Visualizing and quantifying earthworks: Site analysis and planning
Key takeaways
Used integrated CAD + terrain modeling to analyze and plan earthworks for an uneven renovation site.
Created a dense point cloud (42+ million points) to represent existing terrain with high precision.
Imported cadastral boundary data and defined custom height points via the built-in CAD engine.
Generated a proposed “leveled” surface mesh and compared it against the current terrain.
Calculated cut/fill volumes between existing and planned surfaces for project planning.
Produced both technical and measurement reports to guide renovation decisions.
Created before/after visualizations (DSM + mesh) to help stakeholders see volume and elevation changes.
Workflow gave the client clear insight into material needs for leveling, saving time and cost.
Introduction
This project showcases the advanced capabilities of 3Dsurvey software in addressing complex terrain leveling challenges for renovation projects. The software chosen to tackle a project like this would need not only to perform a simple volume calculation, but also offer an integrated CAD engine (to import and edit CAD features), be able to work with multiple surfaces, produce reports and allow custom visualization.
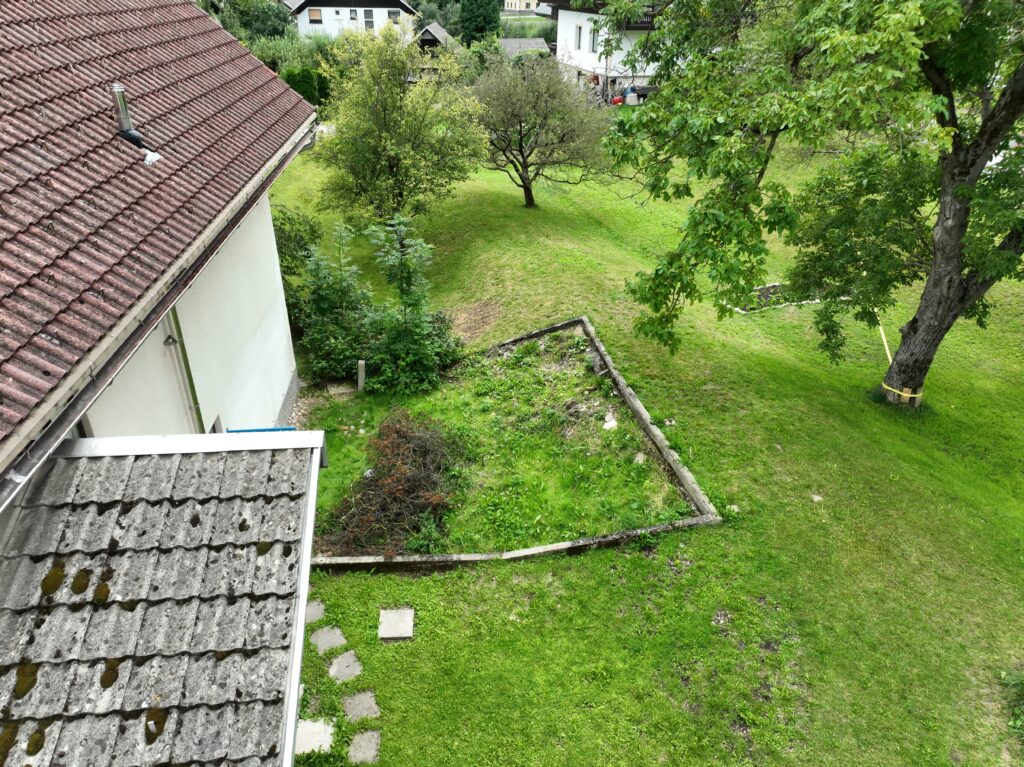
The site
The project involved an old village house situated on uneven terrain, which presented a significant challenge for the homeowner, particularly during periods of heavy rainfall, as the depressed areas were prone to water accumulation. The homeowners wanted to renovate the plot of land, including the old house, and level the terrain around it. They were even considering demolishing the house and rebuilding a new one on the leveled terrain. The potential house rubble would be removed and not used as fill material.
Leveling this uneven backyard was the prime motive of the homeowners.
The problem / objective
The client’s primary objective was to determine the volumetric difference required for leveling the terrain around the house, enabling them to estimate the amount of material needed for filling or excavation.
Additionally, the client requested an analysis of the excavated material for leveling and a visualization of the before-and-after terrain.
Approach
The field work
The site was scanned with Mavic 3 Enterprise dronewith RTK antenna, providing a surveyor grade accuracy. No GNSS or total station was used for this project.
For mapping such a scene a simple grid mission was not enough. It was, however, a good starting point, since a grid mission quickly and efficiently covers a desired area. For more accurate and better looking representation, a circle or “area of interest” mission should be used. In such cases, it is advised to fly multiple ellipses around the object of interest and also tilt the camera upward to get good coverage of roof overhangs.
If possible, fly multiple ellipses around the object/house, tilting the camera upward as you lower the UAV altitude.
For this project 223 images were used. The vegetation posed a challenge, making it difficult to achieve complete coverage of the area.
3Dsurvey processing
Point cloud
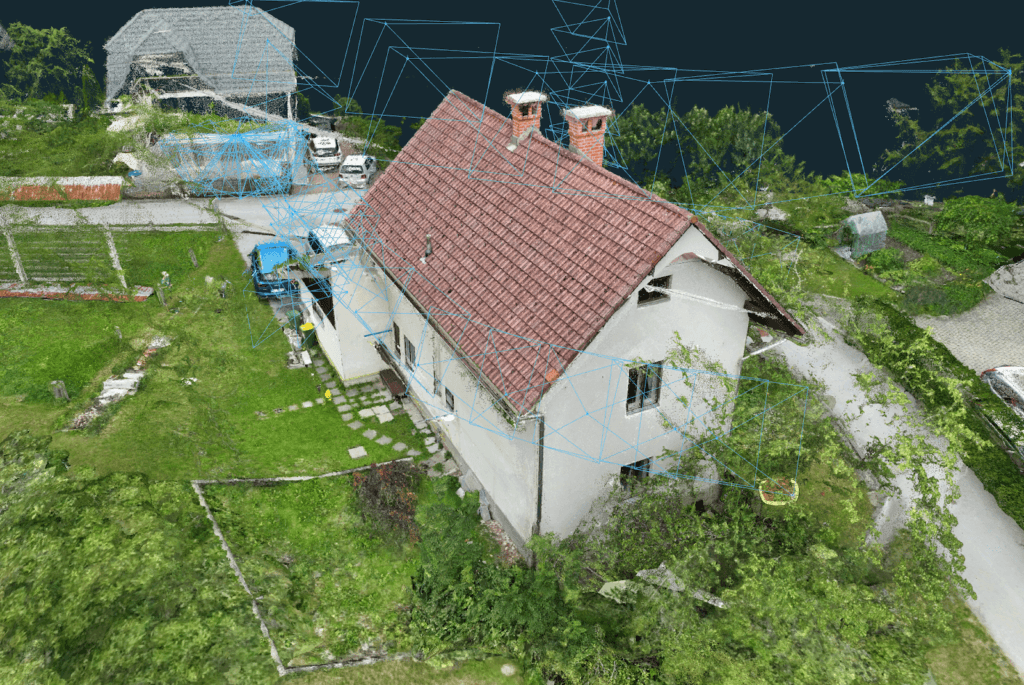
To achieve the main purpose of this task, we needed to get a good surface representation. For this, a dense point cloud is crucial. The calculated point cloud comprised more than 42 million points.
A top-down view on a dense point cloud.
The point cloud was cropped to the area of interest and then classified into two classes. The ground class was then used to calculate the DSM (digital surface model).
Digital surface model (DSM)
Regular grid mesh was produced to represent the terrain elevation model for the current situation. We chose the cell grid size of 0.25 m as a sufficient level of detail.
CAD tool
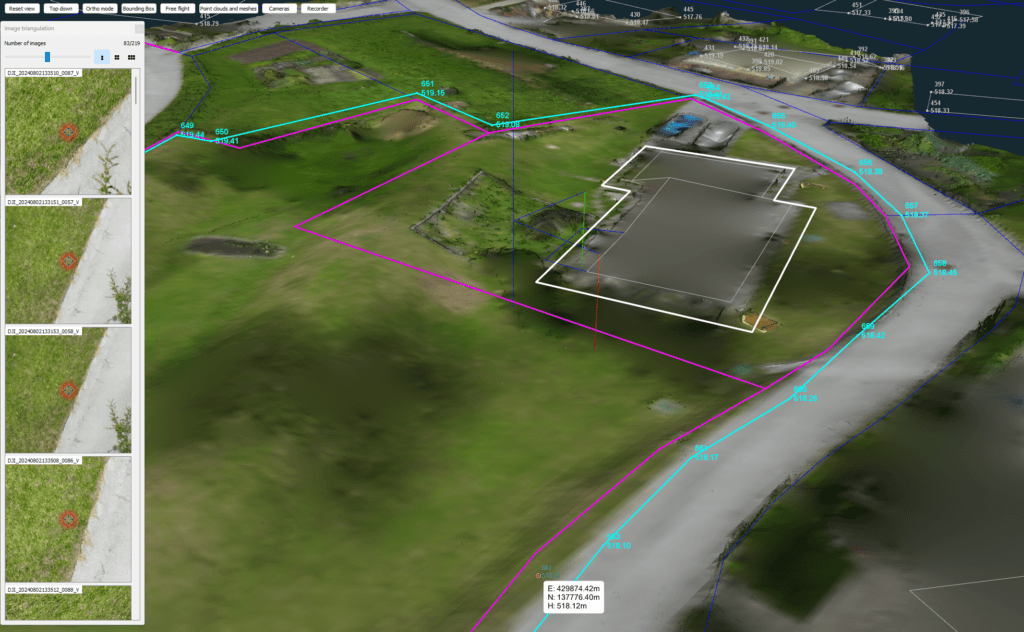
Before calculating the surface model, we imported the cadastral data to define the exact area of interest. For this case we used the publicly available cadastre data.
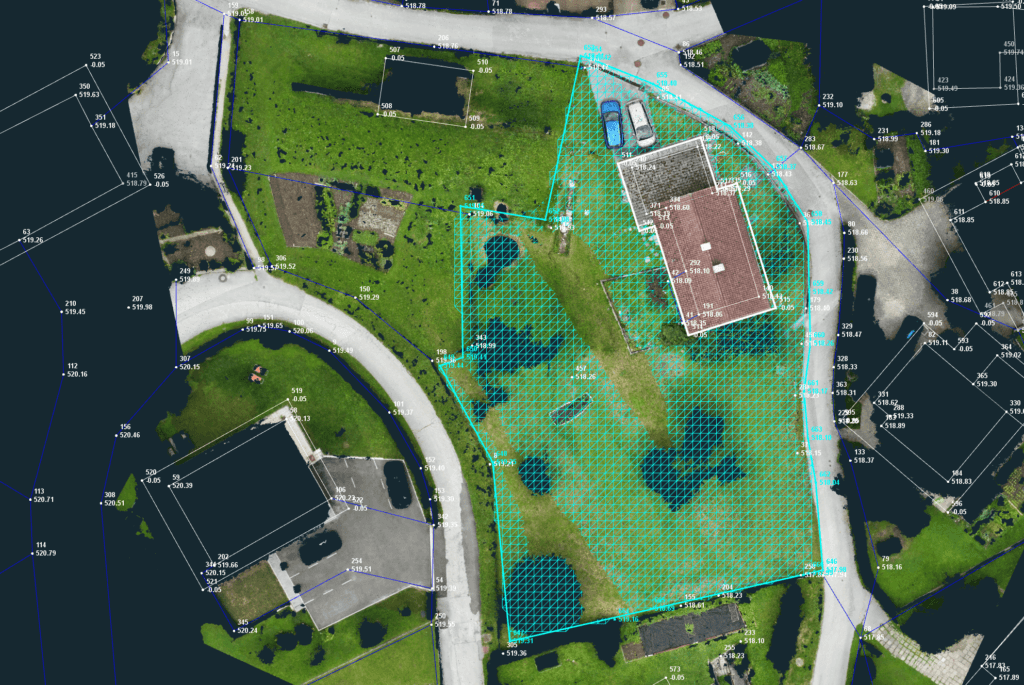
Using the integrated CAD engine we defined our area of interest just within the boundaries of the parcel. Based on the boundary lines, we defined the height points the end customer wanted as a final surface. These serve as input data for surface generation.
Defining the height points within the cadastral boundary for the final surface to be generated.
Generate a surface model out of CAD data
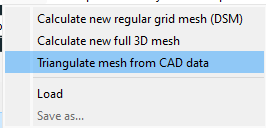
The next step was to produce a final terrain elevation model – the surface on the elevation the homeowner envisioned to achieve. Mesh can be generated out of any CAD data in 3Dsurvey. To do this we used the “Triangulate mesh from CAD data” command.
The command is found under mesh in the toolbar.
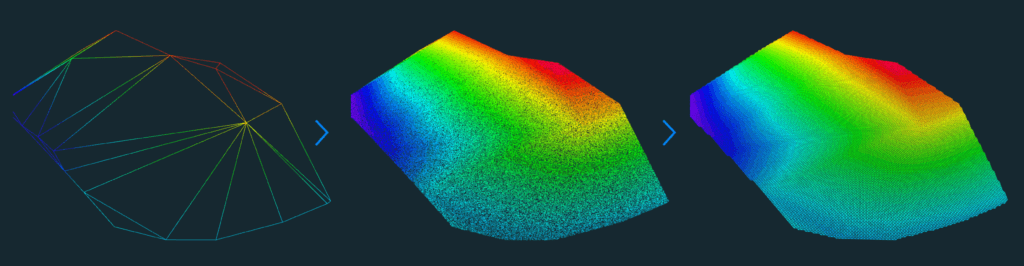
To produce an elevation model of the desired surface, we first calculated a new mesh defined by our CAD points. As input we chose the layer we used to define the desired final height. This gave us a really simple surface representation of only 25 triangles. To turn this into a more comparable DSM, we first converted it to point cloud, [right click on the mesh and select “Convert to point cloud”] and used 1000 points per square meter for density parameter. Out of the generated point cloud we calculated a new DSM with a cell size of 0.25 m.
The process of creating a new, user-defined surface. From CAD points to terrain elevation model.
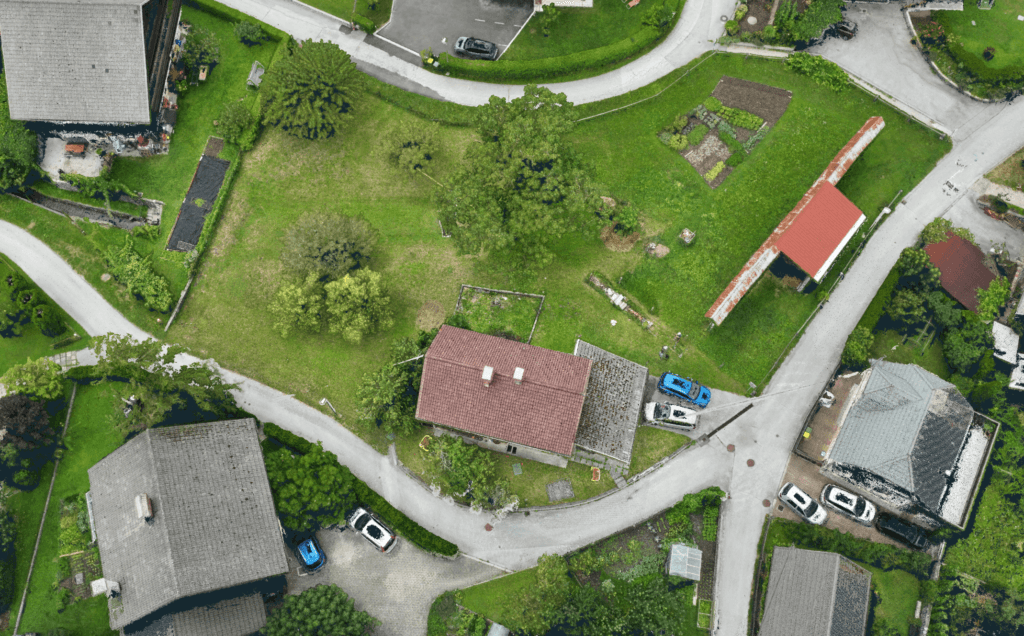
The newly generated surface immediately gives some insight into the relationship between the two surfaces. We noticed that the final surface is generally higher than the current surface.
Top-down visual comparison of the new and the desired surface.
Volume calculation
The main focus of this case was to determine the total volume of earthwork required. So our next step was to calculate the volumetric difference between the existing terrain and the desired, leveled terrain. In addition we wanted to compare scenarios with and without the volume of possible foundation excavation.
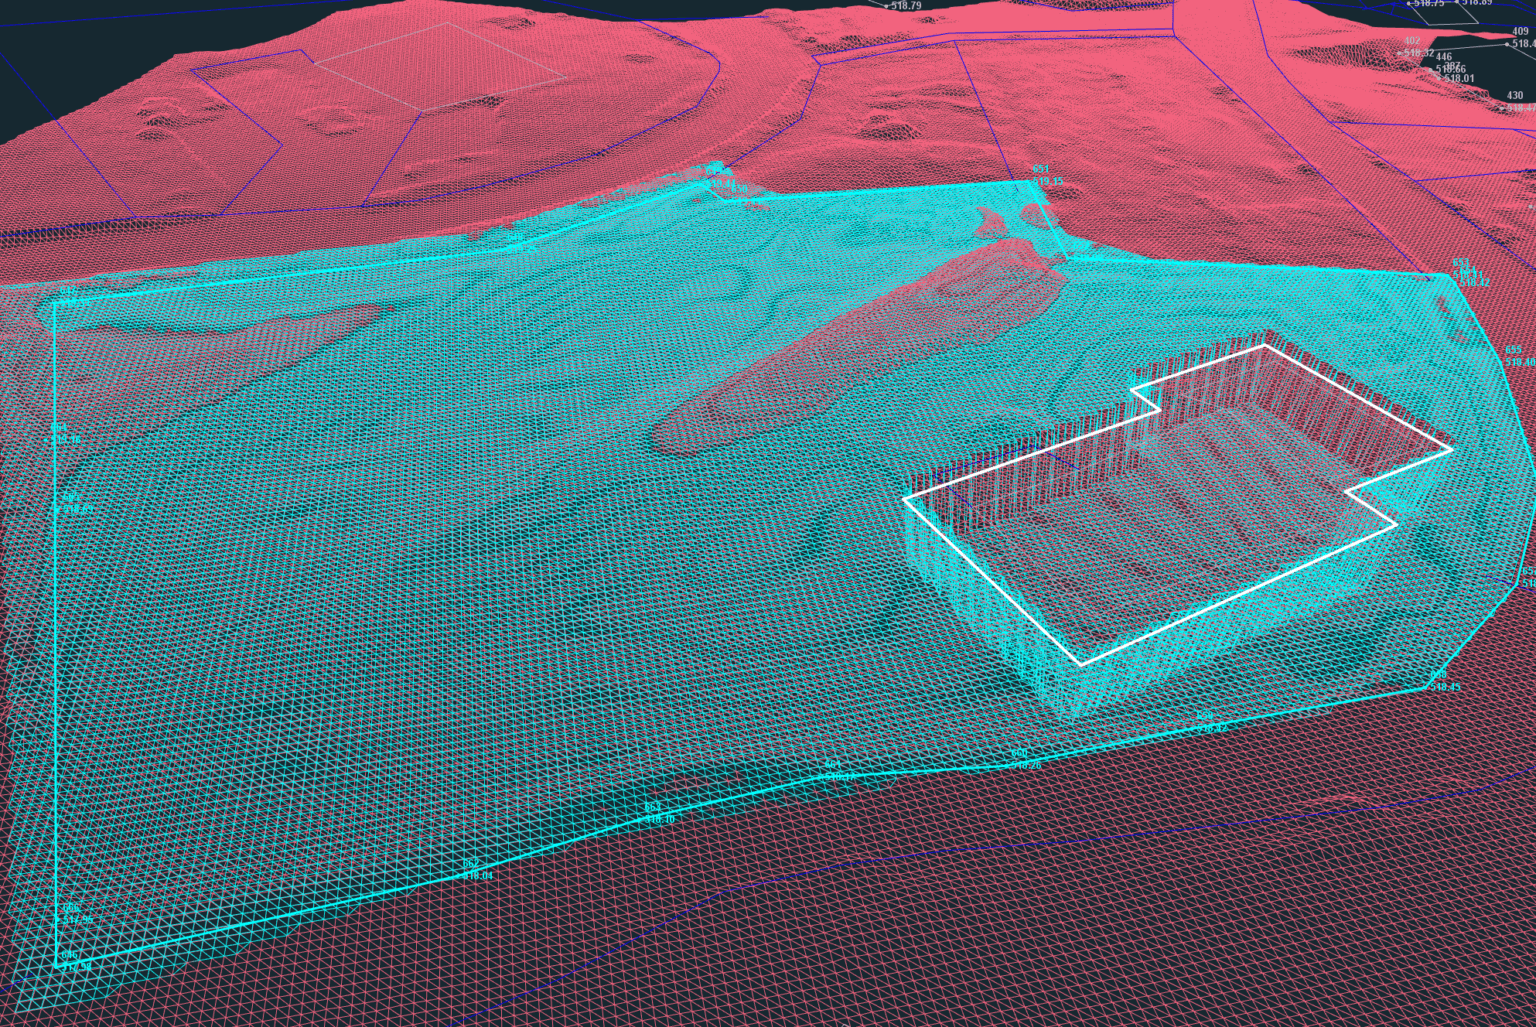
The first scenario was a simple comparison between the “before” state, represented by the existing terrain’s DSM, and the “after” state, represented by the DSM of the desired level terrain. In this case the house was neglected and simply considered as a flat surface.
Comparison of initial “before” surface (in natural color) and the desired leveled surface (cyan)
Volumetric difference was calculated and showed that for this scenario, a large amount of material would need to be filled in.
Report generation
General and measurement reports were generated for the project. The first one serves to provide technical information on how the site was mapped; including the number of images, overlap, precision, etc. The measurement report provided a document clearly listing all the relevant properties of the measured volumes.
Name:
Parcel-original2level_house_flat
Fill:
612.15m³
2D area:
1498.30m²
Cut:
31.87m³
3D area:
1499.59m²
Net:
580.27m³
Lowest point:
517.33m
Highest point:
519.64m
Table describing the volumetric calculations between two surfaces
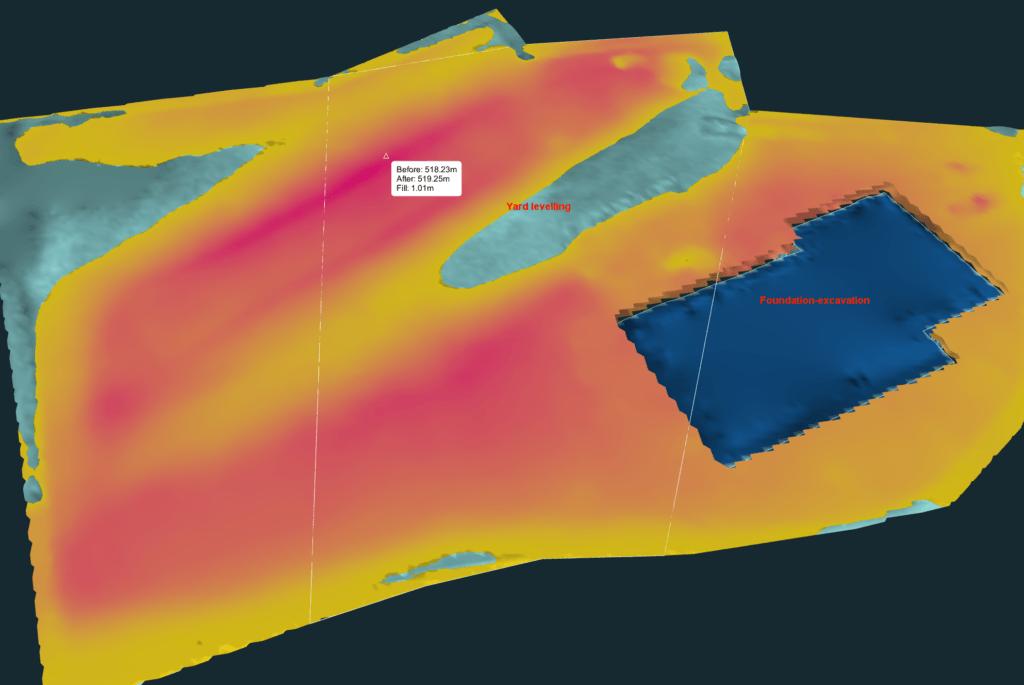
In the second scenario the house was included in the volumetric calculation. The proposed foundation’s depth was 3 m and the rubble material was to not to be included in filling the lot. To get the most accurate results we divided the two volume calculations into Yard leveling and Foundation-excavation.
Two volumetric calculations visualized in 3Dsurvey, one for the yard and one for the house.
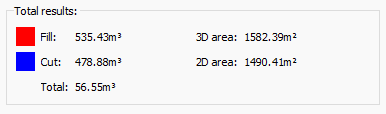
The proposed excavation of the foundations would amount to 447m³. The Yard leveling still generated the need to fill in 535m³, while only 31.87m³ would be gained by cutting the mounds. However, both volumes combined even out almost perfectly. This way the customer was given valuable insight on the anticipated earthworks balance.
The final result of multiple volumetric calculations.
Before / After visualization
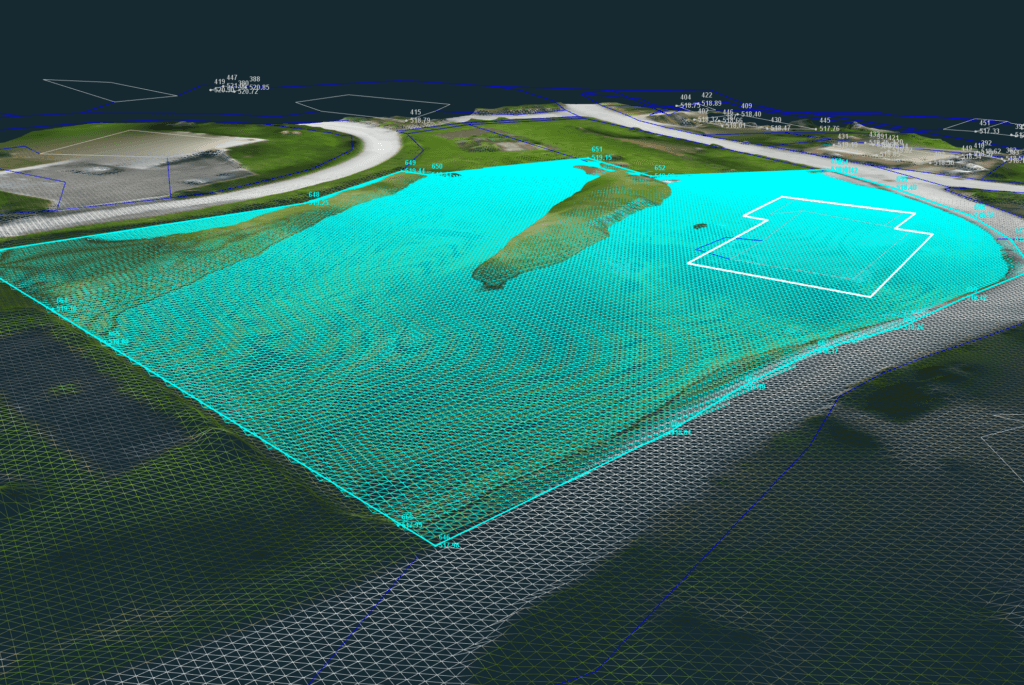
An additional wish of the end-customer was the before and after visualization. For most people such earth volumes are hard to imagine visually. For this reason we went a step further. 3Dsurvey’s capability to work with multiple 3D models in one project was beneficial. Beside the multiple digital surface models generated, a full 3D mesh was also calculated to represent the house.
Before / After view with heightmap visualization and textured 3D model of the house.
Conclusion
This showcase illustrated how 3Dsurvey enabled accurate calculation of the earthwork volumes required for leveling terrain around a house.
The capability to integrate CAD data, generate multiple surface models and provide detailed volumetric comparisons empowered the homeowner with understanding needed to make informed decisions about their renovation.
This approach facilitated optimal planning of material needed, ultimately saving time and costs by streamlining the execution of the leveling process. By providing a clear and measurable representation of the before-and-after situation of the site, this photogrammetric project enabled control and informed decision-making ensuring the project success.