Key takeaways
Drone photogrammetry and LiDAR, combined with GNSS control points, enabled efficient surveying of a renewable energy site (solar farm).
3Dsurvey merged LiDAR tiles and generated DSM/contour layers quickly, supporting terrain and layout analysis without extensive fieldwork.
CAD tools within 3Dsurvey allowed users to import project areas, generate height-point grids, delete unnecessary data, and streamline design tasks.
The software enabled contour line generation with fine intervals (e.g., 0.05 m) for detailed mapping of site slopes, drainage and exposure—key for renewable layouts.
Flexible exports (DXF, orthophoto, DSM) and integration across drone/LiDAR data made 3Dsurvey a strong fit for surveyors working in renewable energy site design and documentation.
Introduction: Renewable energy project with 3Dsurvey
The demand for clean and efficient energy continues to rise, fuelling growth in renewable energy projects like solar, wind, and biogas farms. Behind every successful site development is precise surveying and mapping. In this case study, our users from GEOS3D company explore how 3Dsurvey provides powerful, easy-to-use tools that streamline workflows for surveyors when it comes to renewable energy projects. With a focus on drone surveying using photogrammetry and LiDAR, this case study highlights the speed and clarity 3Dsurvey software brings to renewable energy site planning.
Fieldwork Approach: Drone Surveying and LiDAR for Renewable Sites
Depending on the size of a solar farm or wind energy site, surveyors may spend hours or days collecting data. GEOS3D, a Polish surveying company, was equipped with:
DJI Zenmuse L2 LiDAR sensor mounted on DJI Matrice 350 RTK. Essential for precise mapping of forested areas.
DJI Mavic 3E: Professional photogrammetry drone, a go-to choice for surveyors, which captures high-resolution images, essential for photogrammetry workflow and analysis.
GNSS recievers are needed to complete and verify the accuracy of the point cloud. For this reason the Ground Control Points need to be established. These are critical during the design stage, while the GNSS surveys are also essential for the stake outs and as-built surveys for renewable energy projects.
Processing Renewable Energy Survey Data in 3Dsurvey
Once data from drone surveys for solar farms is collected, the next step is analysis using 3Dsurvey.
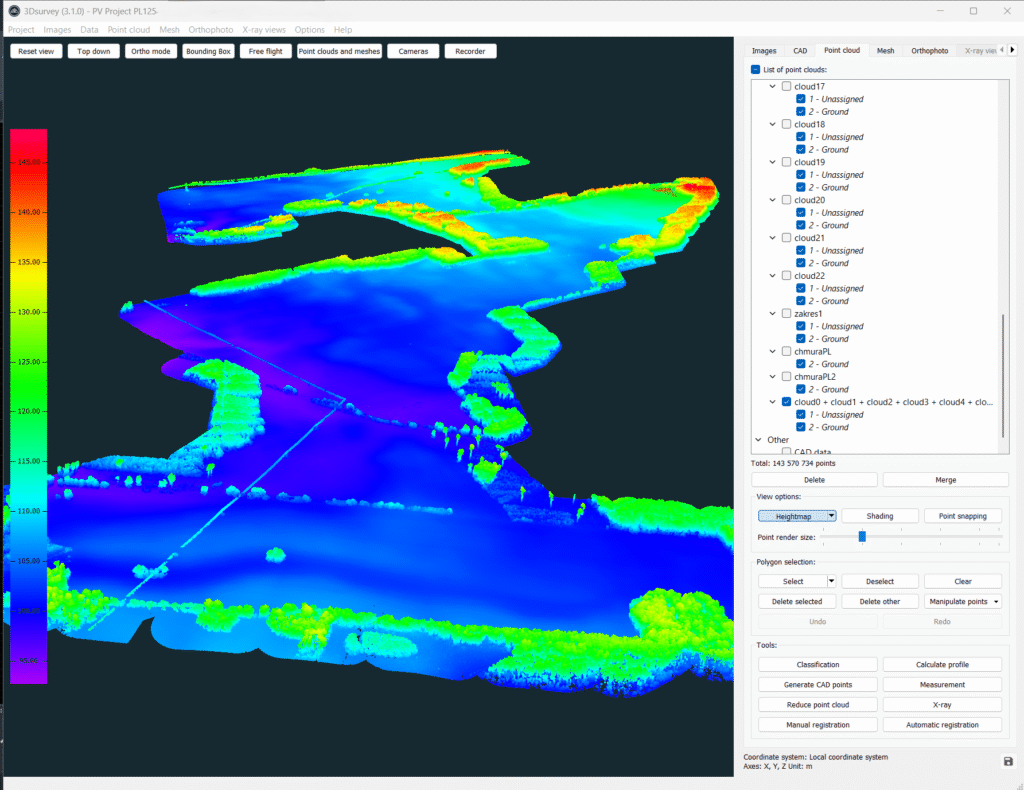
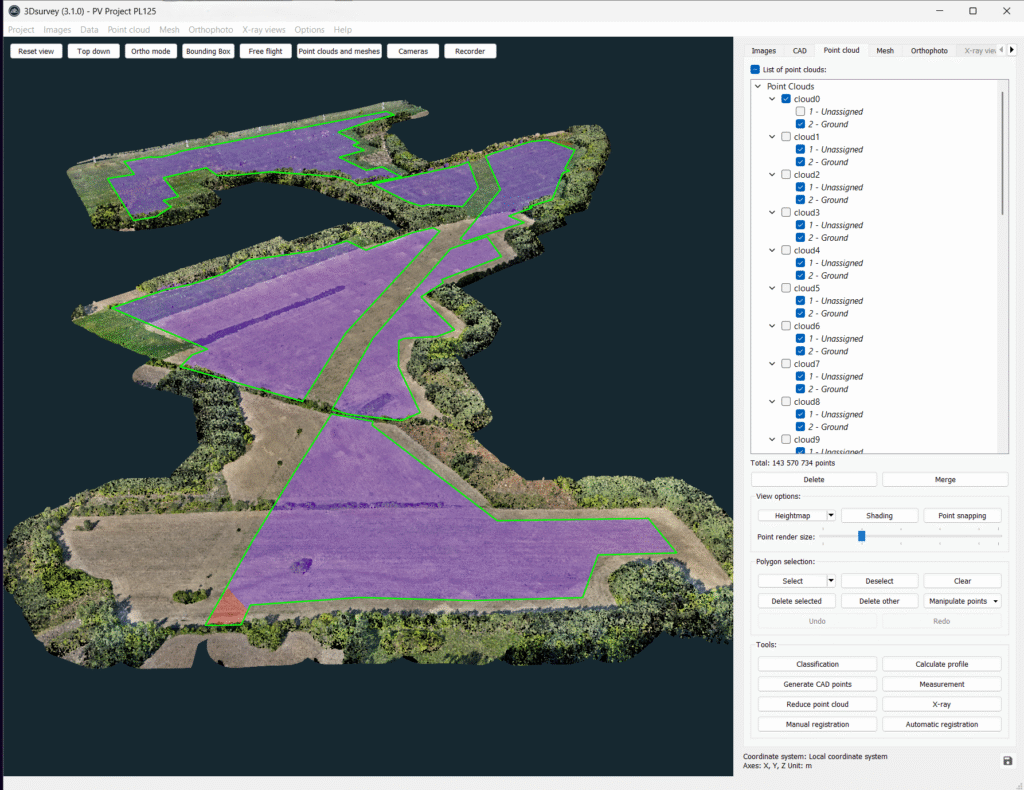
First, LiDAR tiles are merged into a complete point cloud using the Merge tool. The merged point cloud allowed them to work on the whole area at the same time, while performing the next stages.
The new 3Dsurvey 3.1 software version even allows for custom range and colour adjustments on elevation maps, helping teams interpret terrain more easily. You can read more about our 3.1 version here.
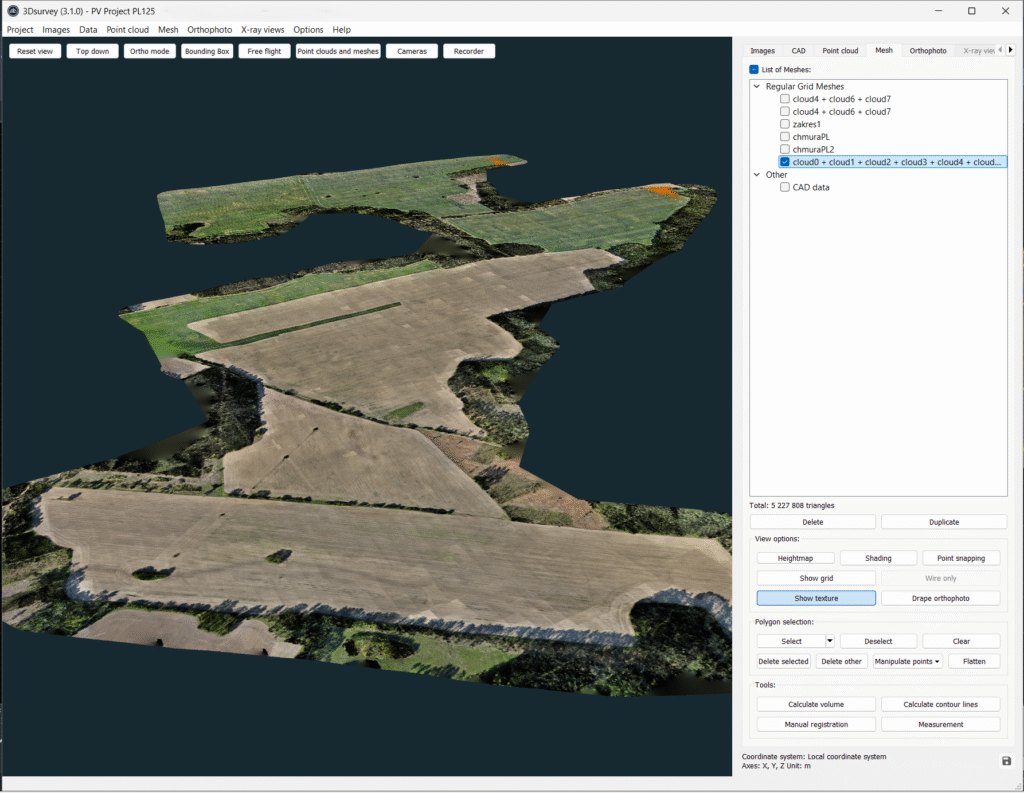
Creating a DSM from classified 2- Ground points is very simple and surprisingly fast in 3Dsurvey. After literally a few seconds, you have a mesh on which you can base your contour map and also perform analysis with the CAD module.
Using CAD Tools for Accurate Renewable Site Mapping
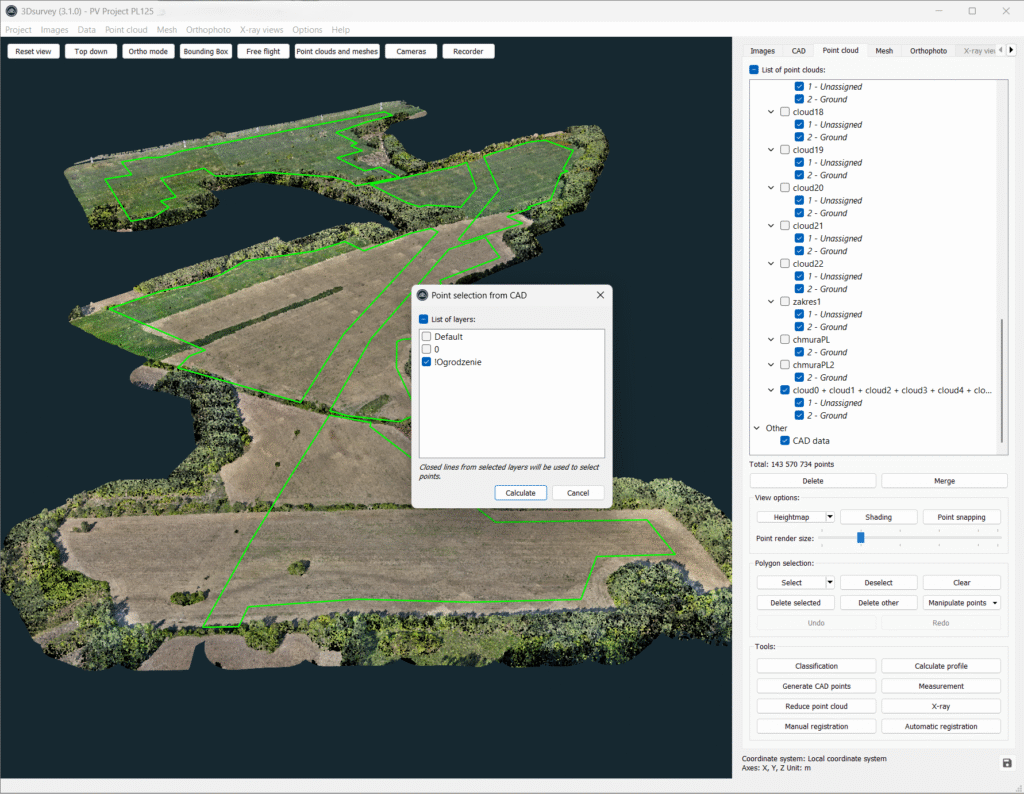
Photovoltaic farm, presented in this case study, was divided into several fields. For further analysis the team needed to import all its projected areas by using option Data → Load CAD. This function enabled them to work only on the area they were interested in.
Thanks to the Select from CAD button, they could separate and additionally delete all unnecessary data around their area of interest. The same selection allows to generate the regular grid of height points.
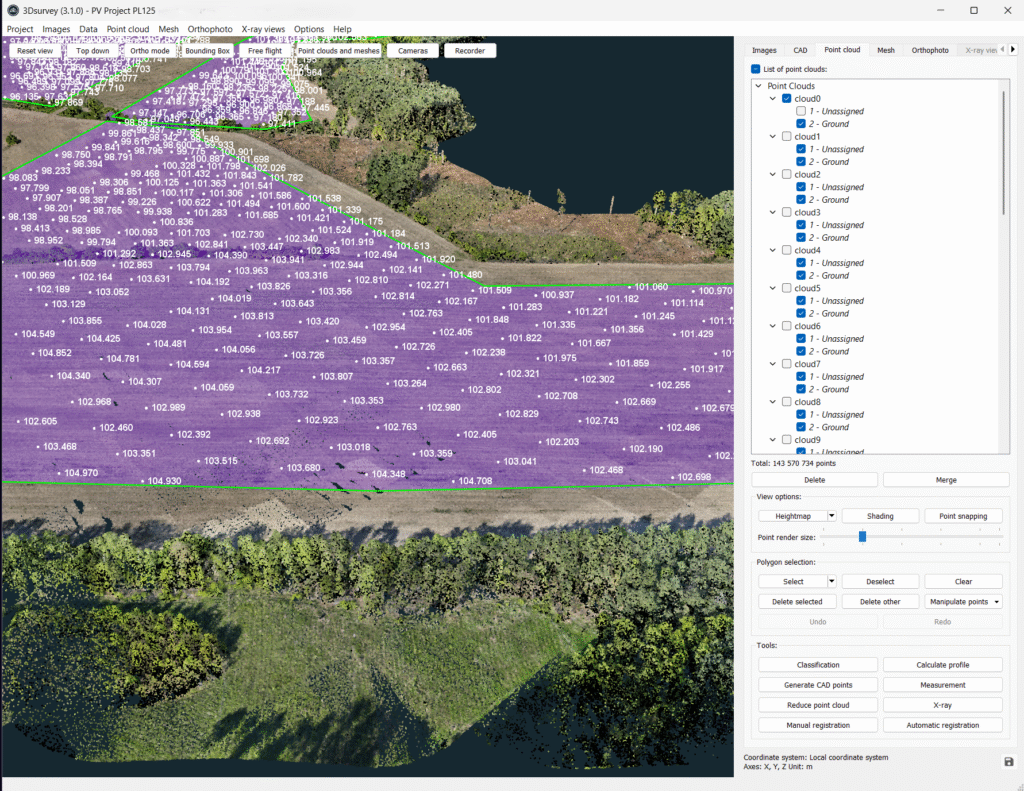
They used Generate CAD points and selected the appropriate density. Depending on the
area, the grids are usually in resolution from 5m to 30m. This greatly improves the entire process and surveys. Without this function, the whole area would have to be walked through and
measured with the same accuracy. This would have significantly increased the time to
complete the survey.
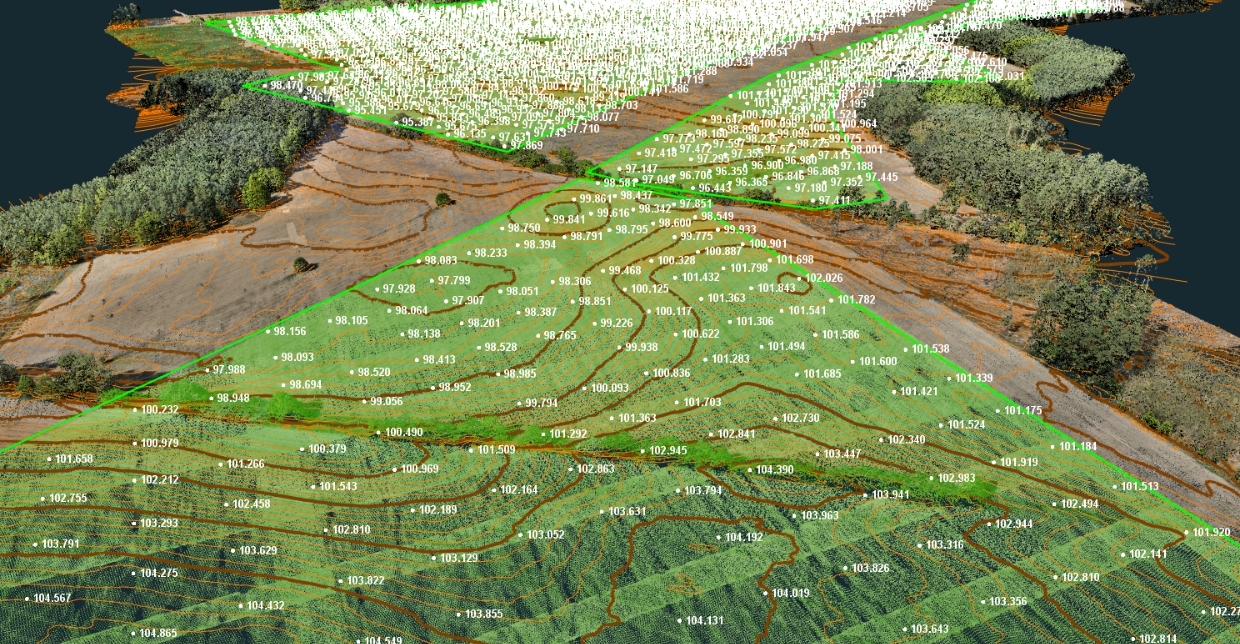
Grid data is important, especially at the design stage. Height points in a regular grid are a
generalization of all the data that the point cloud contains. The analysis that can be carried out with
them is the basis for optimizing the location of objects. In addition to the elevation grid,
contour lines are useful in the analysis of e.g. sun exposure or slopes relevant to water
drainage or erosion.
Contour Lines and Elevation Mapping in 3Dsurvey
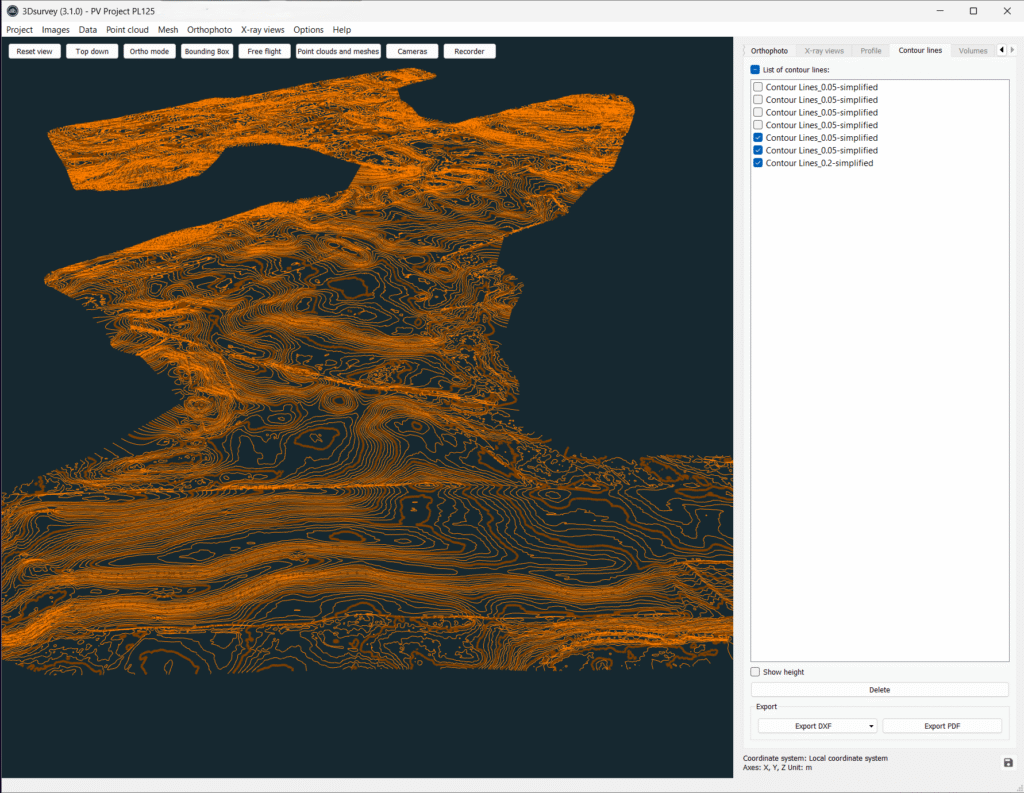
To obtain contours, select Calculate contour lines. After selecting the parameters of interest –
contour interval – the contour lines tab appears. Different contour intervals can be
created for different locations. In this case, a 0.2m cut has been created for the entire area, while a
0.05m interval has been created for individual fields.
You can see the final result in the screenshot below.
Conclusion: Why Use 3Dsurvey for Renewable Energy Projects
The ability to export results in various formats (.dxf CAD files, orthophotos, DSMs, text files) and at different stages ensures a big flexibility, provided by 3Dsurvey. Whether you’re preparing layouts for wind farm development, conducting drone surveys for solar farms, or managing as-builts for biogas sites, 3Dsurvey supports each step with speed and accuracy.
In summary, 3Dsurvey enhances every stage of surveying, from data capture to final deliverables when it comes to renewable energy projects. By integrating photogrammetry, LiDAR, drone surveying, and CAD tools, it empowers professionals to plan, analyse, and execute complex renewable energy projects more efficiently.
If you haven’t tried it yet, we offer a 14-day free trial with no limitations and no credit card needed. Try it out and get inspired! Streamline your workflow today.