A bathymetric survey plays a vital role in flood prevention by providing precise data on riverbeds and surrounding terrain.
The Geos3D team conducted extensive river measurements across Poland using an echosounder, GNSS receiver, and drone-based LiDAR and photogrammetry.
Combining aerial and ground survey data enabled the creation of highly accurate 3D river cross-sections for national flood risk mapping.
All data was processed in 3Dsurvey software, integrating bathymetric, LiDAR, and CAD data into a unified 3D model.
The project demonstrated 3Dsurvey’s flexibility, testing two different workflows that both delivered accurate and reliable riverbed profiles.
Introduction
Water is an unpredictable force of nature and the cause of some of the most dangerous natural disasters. That is why flood prevention is so important. All over the world, there are special organisations that control water levels, analyse risks and look for solutions. But first, they need data to analyse. This is where the bathymetry survey comes in. The basic information required is cross-sections of rivers and their surroundings. The data obtained is then processed by specialists and used to improve flood prevention.
Approach
Fieldwork
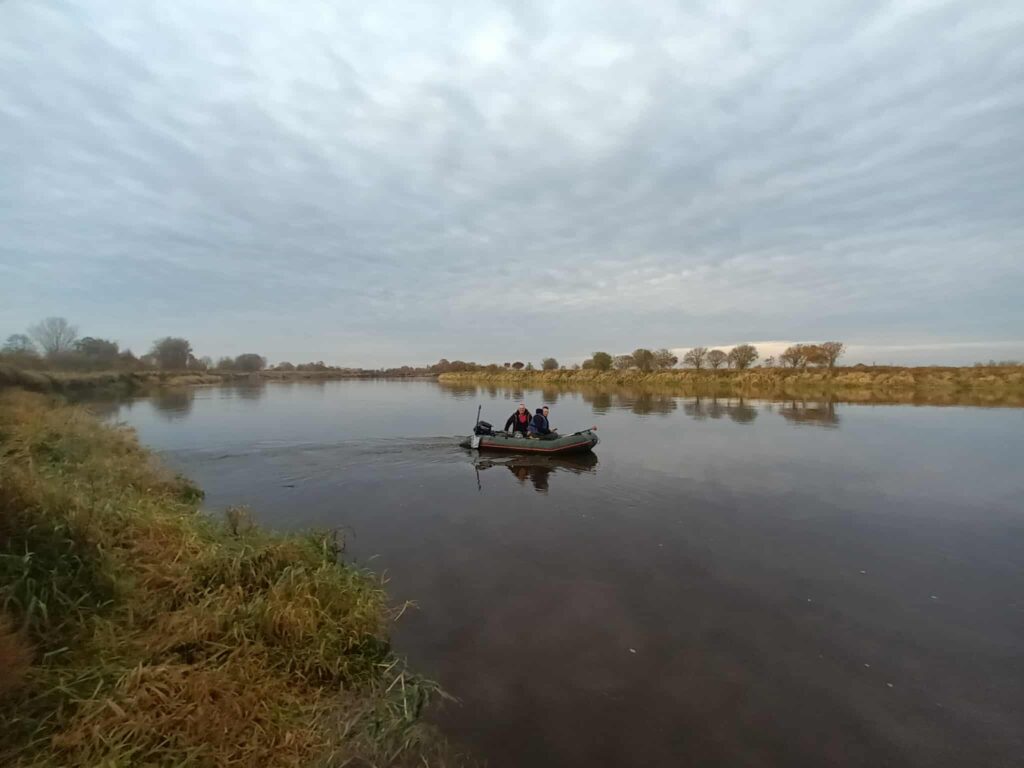
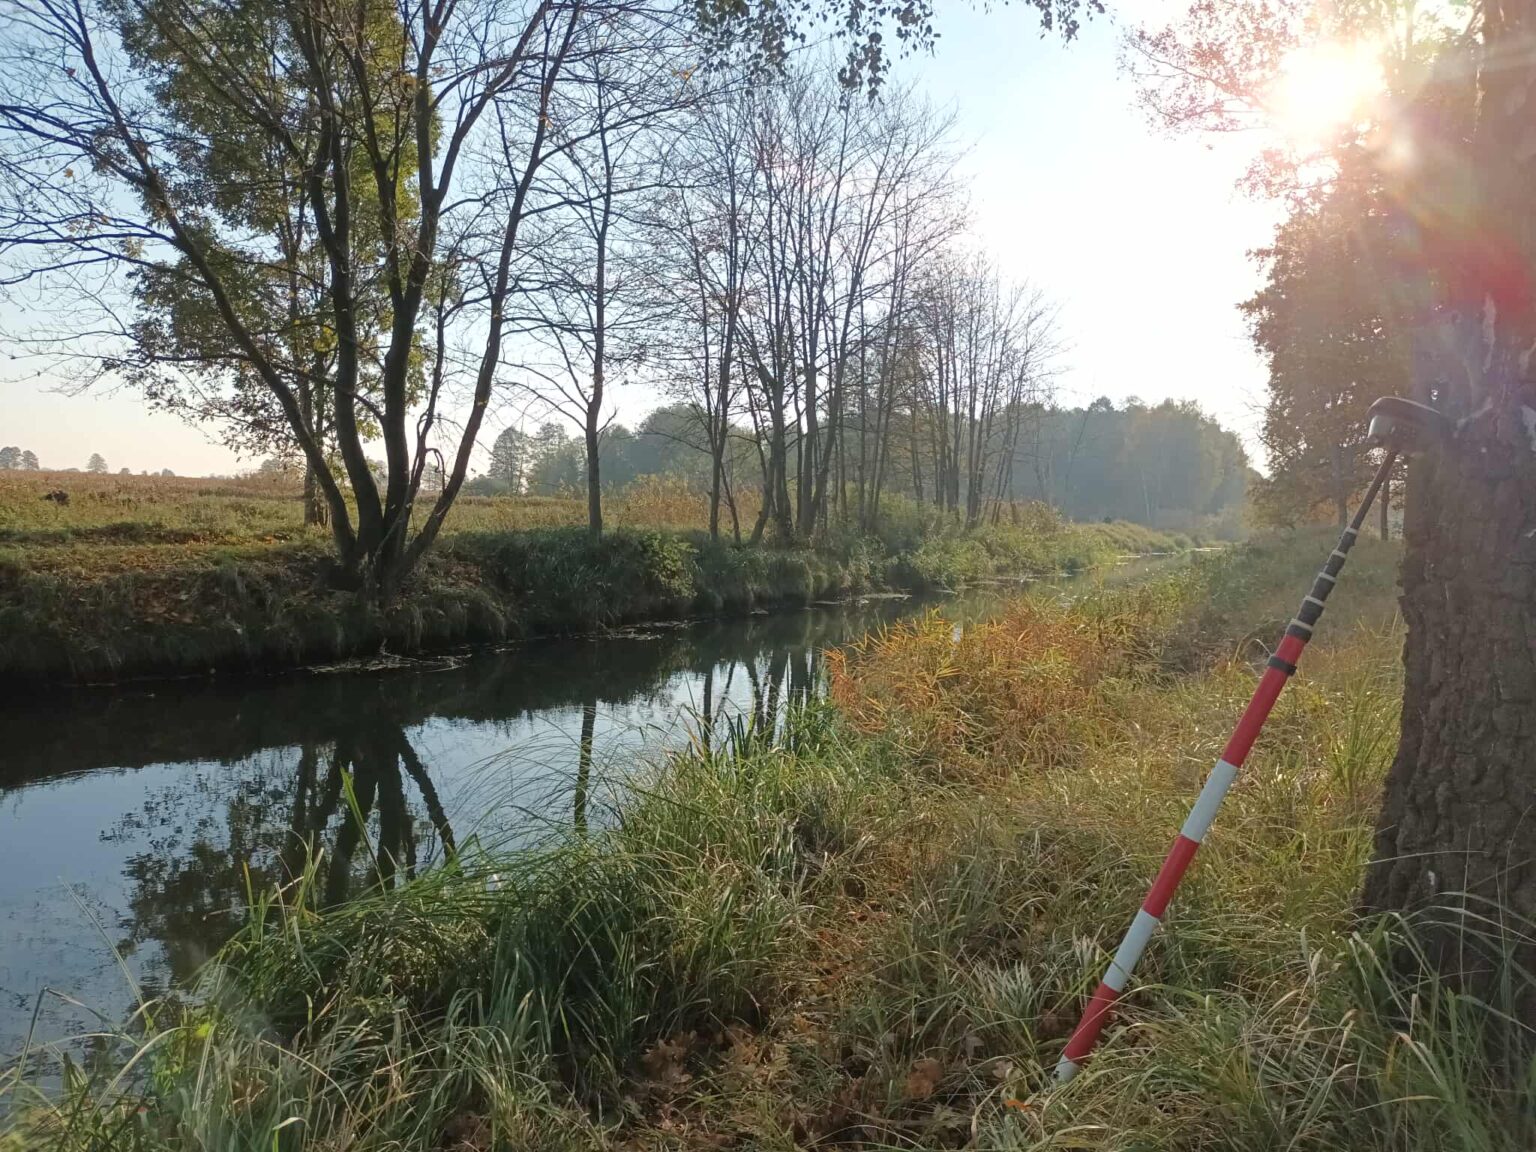
Rivers, lakes, and other watercourses vary in width and depth. Using the right equipment and maintaining safety are critical. Surveyors from Geos3D recently conducted extensive bathymetry survey of Polish rivers using a pontoon with an echosounder. In some cases, they also employed a remote-controlled boat or walked along the river with a 4-metre pole and a GNSS receiver.
A bathymetry survey on the pontoon boat.
These bathymetry surveys form part of a national project to update flood hazard and flood risk maps.
The surveys combined:
ground measurements with aerial data collected using drone-based photogrammetry
LiDAR scanning, providing essential 3D analyses for accurate modelling.
Vegetated riverbanks and slopes were mapped using GNSS receivers to ensure precision and avoid gaps in the LiDAR point cloud. Each cross-section location was provided by Państwowe Gospodarstwo Wodne Wody Polskie (State Water Holding Polish Waters), along with clearly defined survey guidelines.
Office work
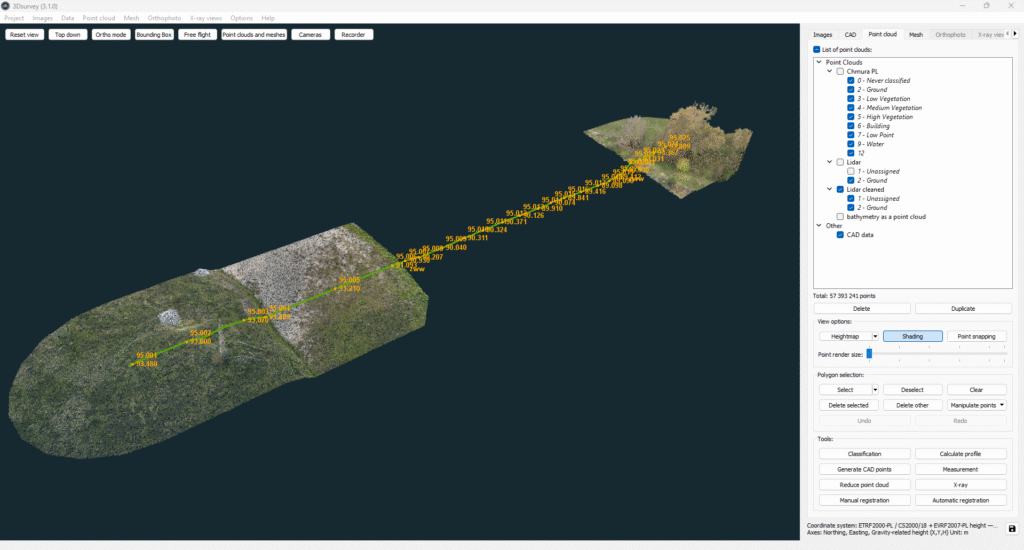
All data collected from the bathymetry survey was imported into 3Dsurvey software. Additionally, a point cloud from the national geoportal was used for cross-checking and error detection, though it was not included in further processing. Cross-section lines divided into 1 m sections served as the project’s base.
First approach
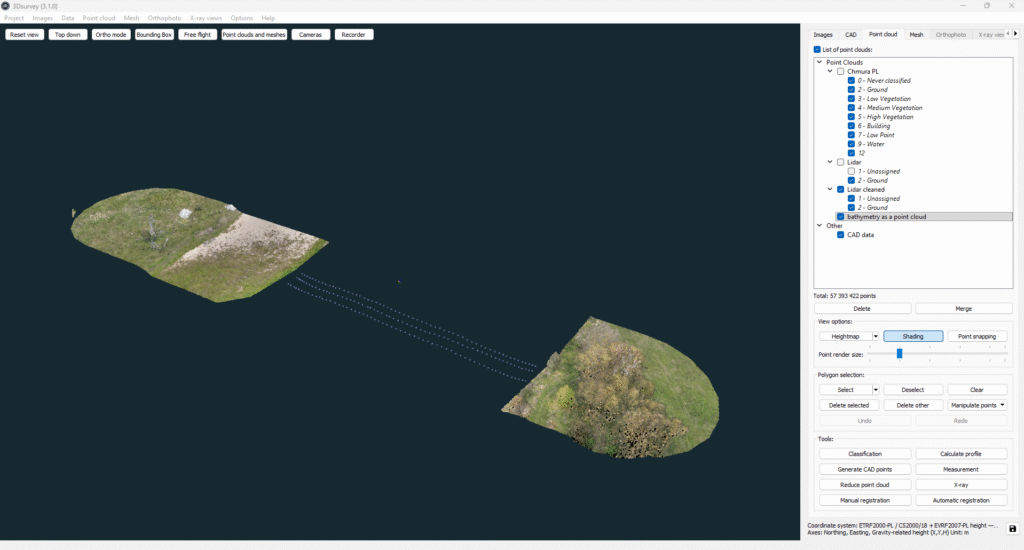
Initially, bathymetric data from the echosounder was imported as a point cloud (.XYZ format) instead of CAD data using the Load Point Cloud option. These point clouds were then merged to create a regular mesh. While this method worked well, differences between the triangle mesh on land and water were noticeable.
Bathymetric points as point cloud.
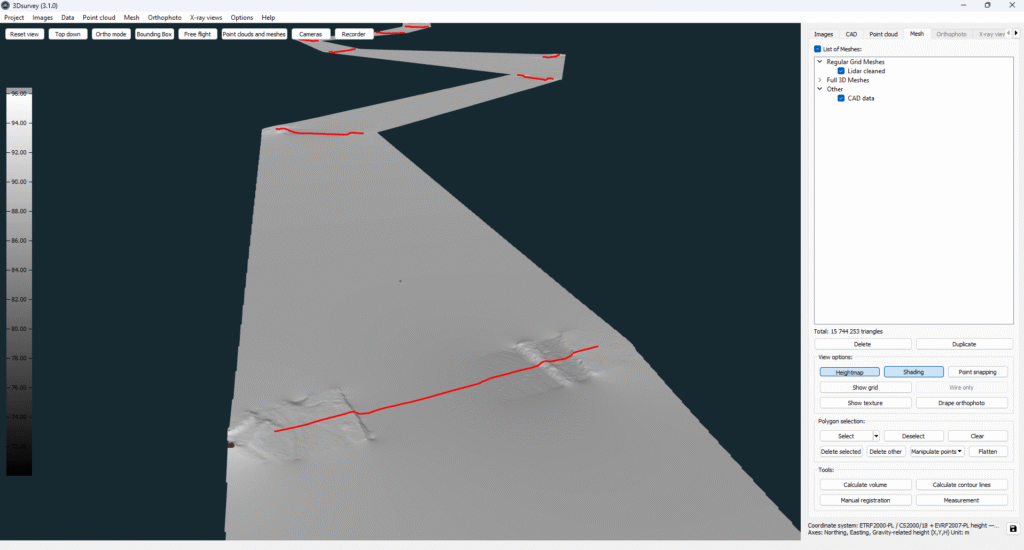
Next, the CAD-to-Mesh projection feature was used to drag cross-section lines onto the mesh surface, producing highly accurate riverbed and lake-bottom profiles.
CAD-to-Mesh projection.
Second approach
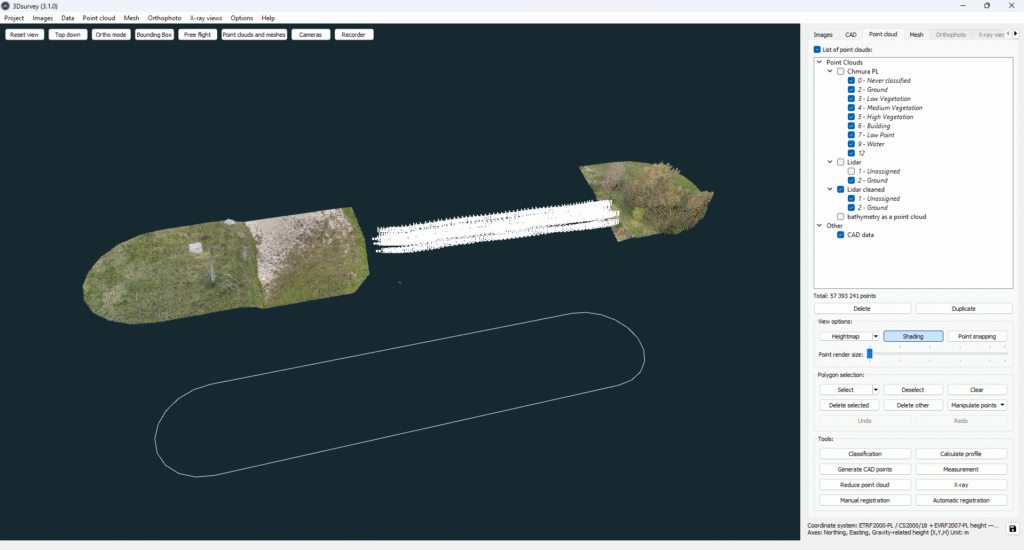
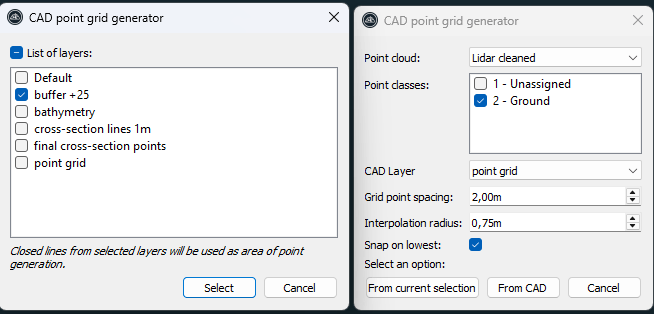
Another workflow tested the automatic CAD point generation option, importing bathymetry results as CAD data with an additional CAD layer. A buffer area of +25 m was applied to each cross-section, which was critical for creating a dense CAD point grid.
The imported data form echosounder and prepared buffer areas.
It was important to use the correct settings when creating the CAD point grid. For best performance, only class 2-ground point clouds were used and the “Snap On Lowest” checkbox was selected. The selection was made from the CAD layer where buffer areas had been previously prepared, as these should be closed CAD objects.
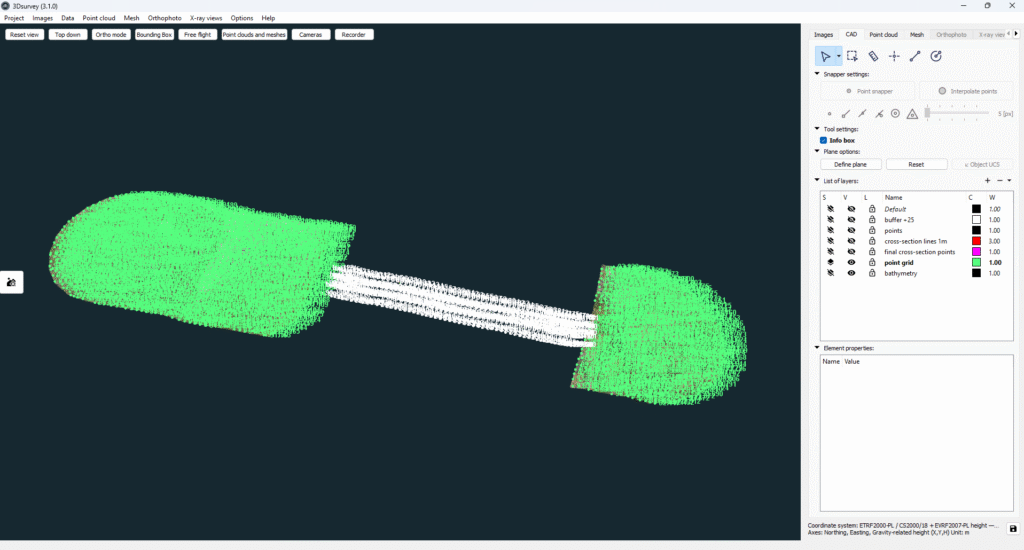
The dense point grid enabled the creation of a full 3D mesh. The results of this solution were more accurate and reliable compared to the previous method. Much more data was processed to reflect the actual surface of the terrain.
Generated CAD points and bathymetry results.
Data analysis
The subsequent stages of work were the same as in the initial concept. CAD data inserted in accordance with the project requirements was projected on the new grid. Then, points were created in the CAD tab on each cross-section line obtained on the ground. After completing all the steps, the final step was to export the finished profiles.
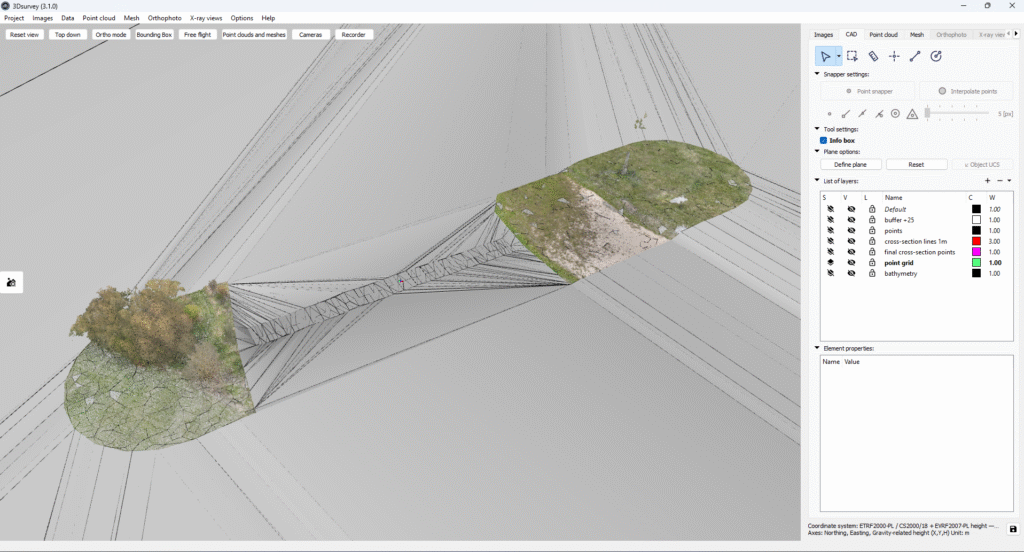
Full 3D mesh in 3Dsurvey.
Conclusion
The entire office workflow for these bathymetry surveys was conducted using 3Dsurvey software, from data integration and workflow optimization to creating complete 3D riverbed profiles.
The project demonstrated the versatility of 3Dsurvey, successfully testing two workflows that both produced accurate and reliable bathymetry survey results. Tools such as Profile Calculation and CAD point management enhanced the workflow and allowed precise data processing.
3Dsurvey software is great for a bathymetry survey project.
With 3Dsurvey, every day brings new opportunities to streamline a bathymetry survey and produce detailed 3D terrain model efficiently.
Want to see it for yourself? Download our 14-day free trial.