

Photogrammetry as a Tool for the Forensic Documentation
When a road accident happens, the authorities must close the road for traffic. Sometimes the road closure takes hours, as they not only need to make sure safety is restored but they also need to investigate the accident scene. This not only affects the people involved in the accident but also other motorists since traffic congestion, re-routing, and delays causes a lot of dissatisfaction and lost working hours.
The first important part of the process is documenting the scene as is. Therefore scene mapping should be captured as soon as possible, ensuring all details stay intact.
Secondly, you must collect as many details as possible. The data will be used by several people, including police forces and insurance companies. Specific calculations will be done to determine reasons of why an accident occurred.
The third important aspect to note is that investigators are provided with professional tools that help them to process collected data. This means accurately and precisely measuring and calculating the distance between parts at the car crash scene, angle of the crash, skid marks and final rest positions. Only with accurate measurements can they properly determine reasons of why an accident happened. Calculations can be done “offsite” later in the office.
PROJECT DESCRIPTION

The problem
Until now the local forensic department had 2 options when investigating a road accident:
- Use of a laser scanner which provides good results. However, laser scanners are expensive and therefore only a limited number of devices are available. This causes delays and complex resource planning, and transferring devices from one part of the country to another.
- Or the traditional approach meaning hand sketches and taking around 100 photographs at the scene. This method provides the documentation of the car accident site, but it does not give good situational awareness. The sketching of a larger site can also be very time consuming, bearing in mind that the accuracy would be limited.
Approach
The local Police department wanted to understand how and if photogrammetry could help with easier and more accurate data collection. This would mean calculating crash angles, speed of cars, identifying objects and measuring and calculating distances, exclusively using photos from drones, ground photos and photos from bystanders. The Police department wanted to understand how much faster they could remove the crash scene and relieve the traffic. They were also interested to find out how much easier, faster and more accurately calculations with photogrammetry software could be.
SOLUTION
Fast data acquisition

For absolute accuracy, the project must be scaled and/or have control points defined. 3Dsurvey targets (ground control points, placed with the distance in-between of 3 meters) were used as a base for orientation. This technique is 5x faster and the cost is 1/20th of the price of GNSS device. The police could handle many more cases simultaneously and spend less time on a non-secure area. They could also achieve the same level of orientation quality. Comparing GCP points to GNSS devices, users do not need any training to position the targets.
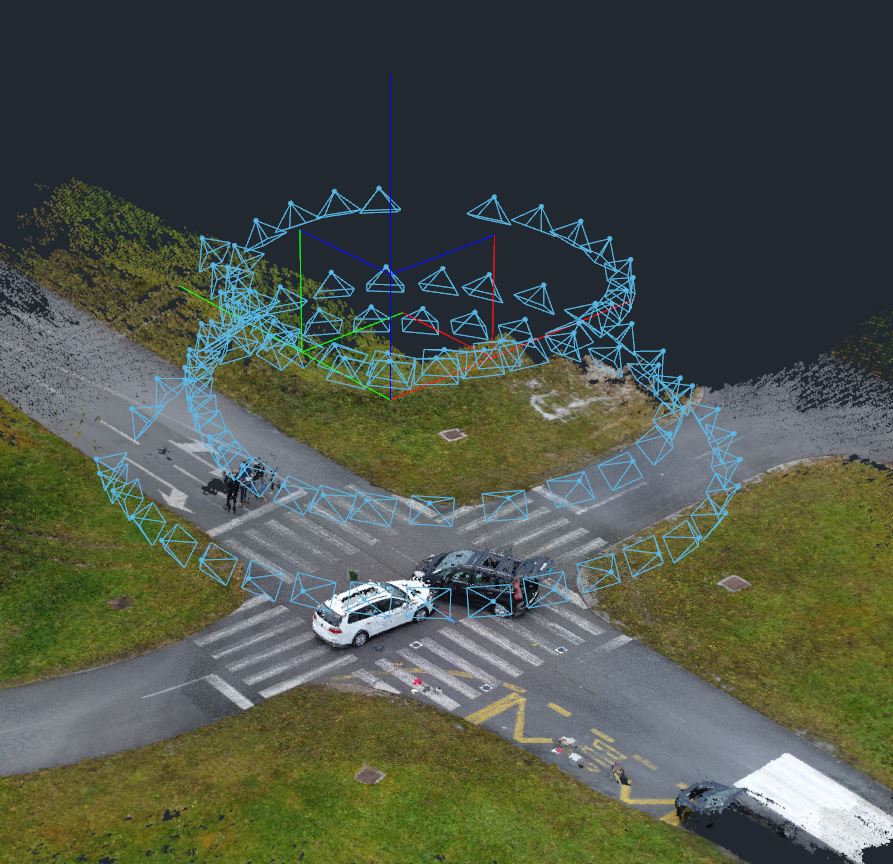
The scene of the accident was captured with a DJI Phantom 4 Pro, a mid-range and affordable drone. Since users were not experienced in flying drones, the flight mission was automated by the 3Dsurvey Pilot app. The circle mission mode was used to automatically capture the images. 3Dsurvey Pilot app navigated the drone around the scene on the predefined perimeters. These were set prior the flight at the scene using google maps in the 3Dsurvey pilot app. To increase the level of details collected, the drone was set to collect images 3 times, each time from a different height. These images will later be used to create a 3D model of the accident scene using photogrammetry software.
Once images were taken, the Police were able to approve the removal of the crashed cars and re-open the road for traffic. The complete set of pictures were then taken to the office for the mapping process.
Project tools and specs
Drone: DJI Phantom 4 PRO
Camera: on board, 120 images – 3x circular flight (height 10m, 15m, 20m)
Number of GCPs: 3 – local coordinate system;
Area of interest: 50m x 50m
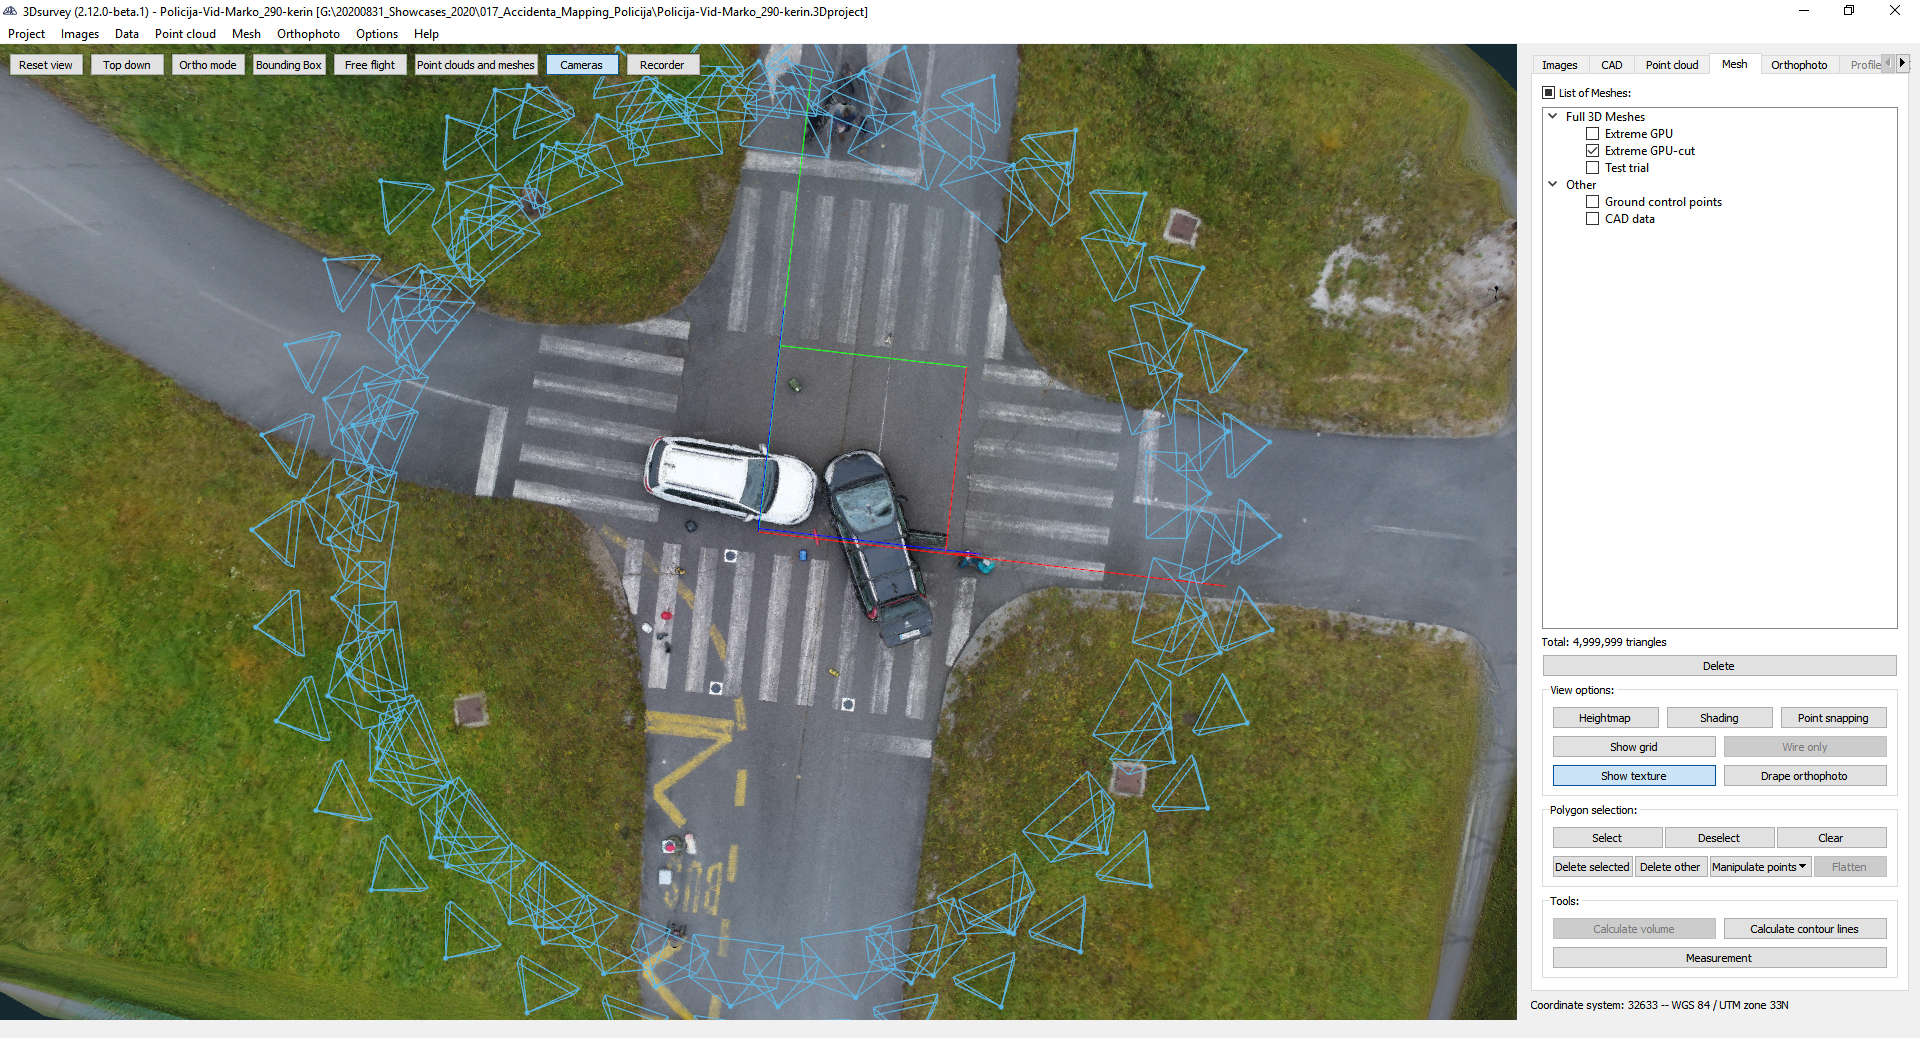
Mapping the scene
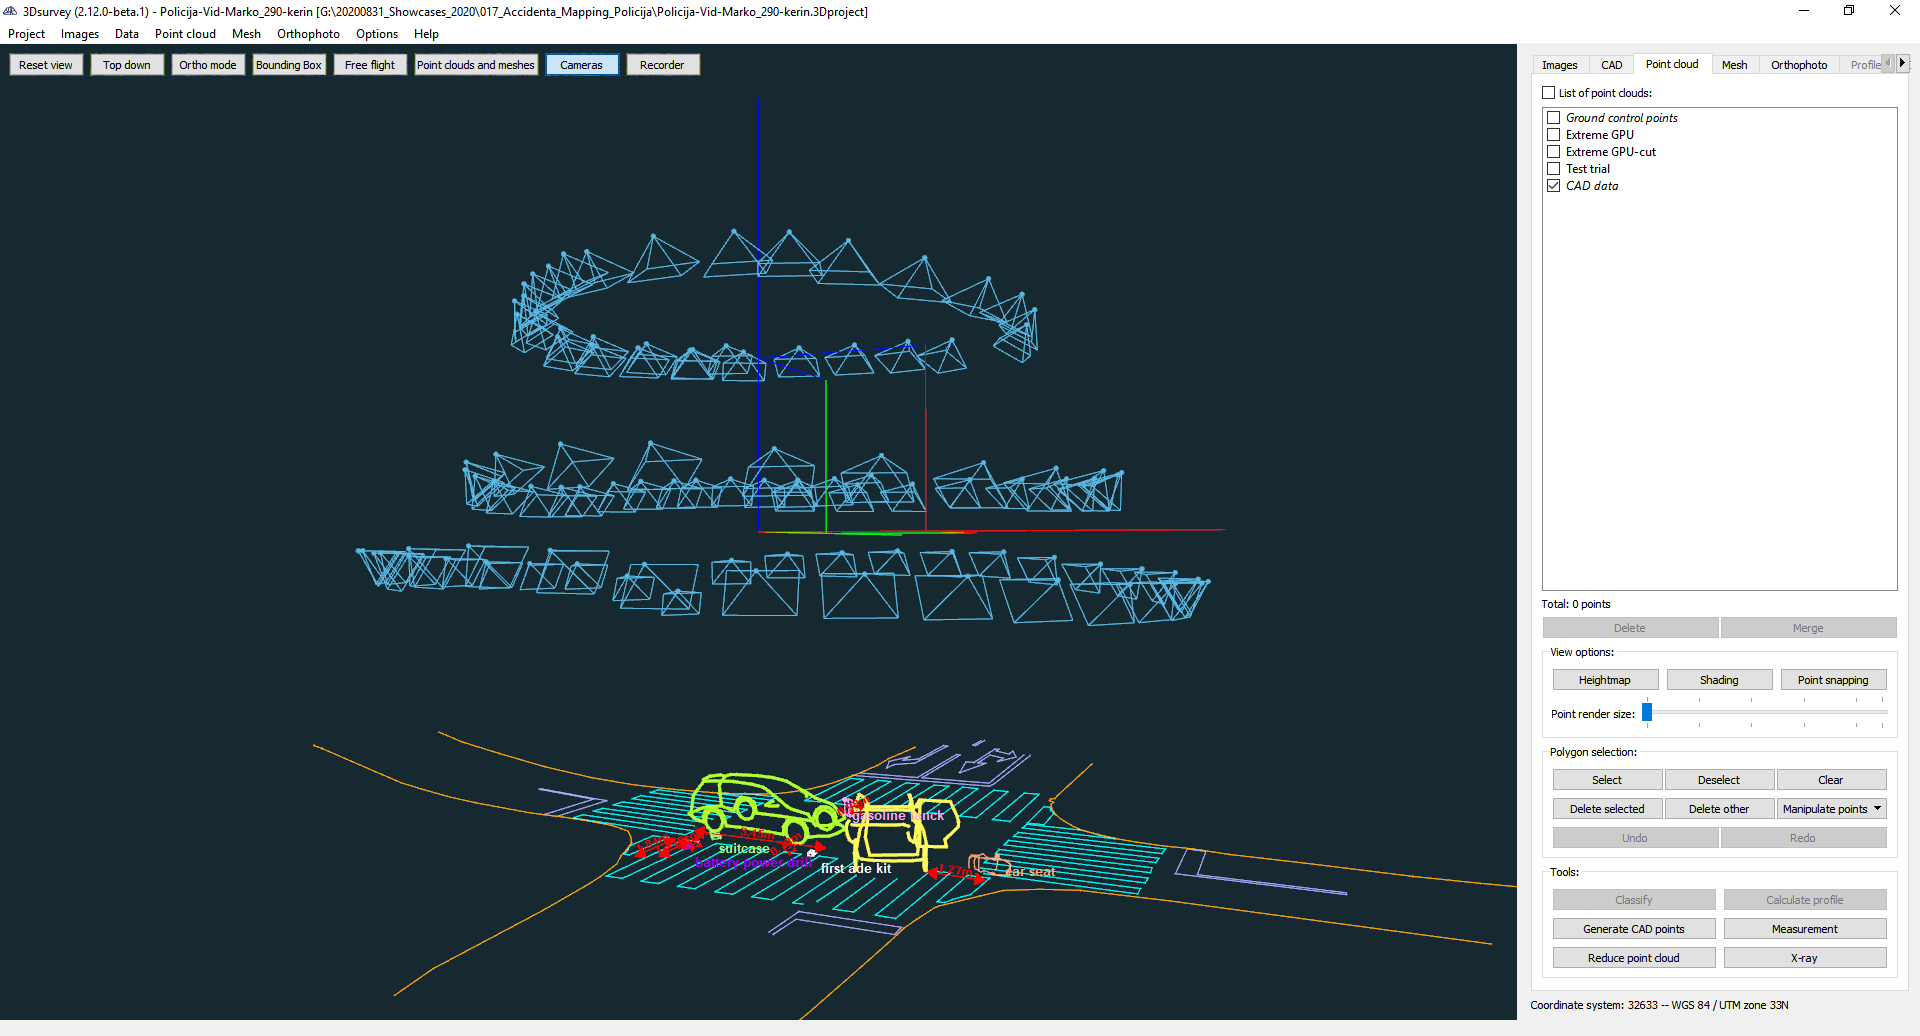
The process in 3Dsurvey begins with importing all the photos taken from the accident scene into the software. With the bundle adjustment step the software recognizes and finds common points between images, matches them and generates a raw 3D model called a “sparse point cloud”. Next, the orientation of images needs to take place.
Because 3Dsurvey ground control points were used, we only needed to hand-pick 3 GCP points on a single image. All other GCP points are automatically detected. The software will automatically list all the images where the ground control points are visible, achieving the highest grade accuracy (up to 2 cm survey grade accuracy) in scale and measurement.
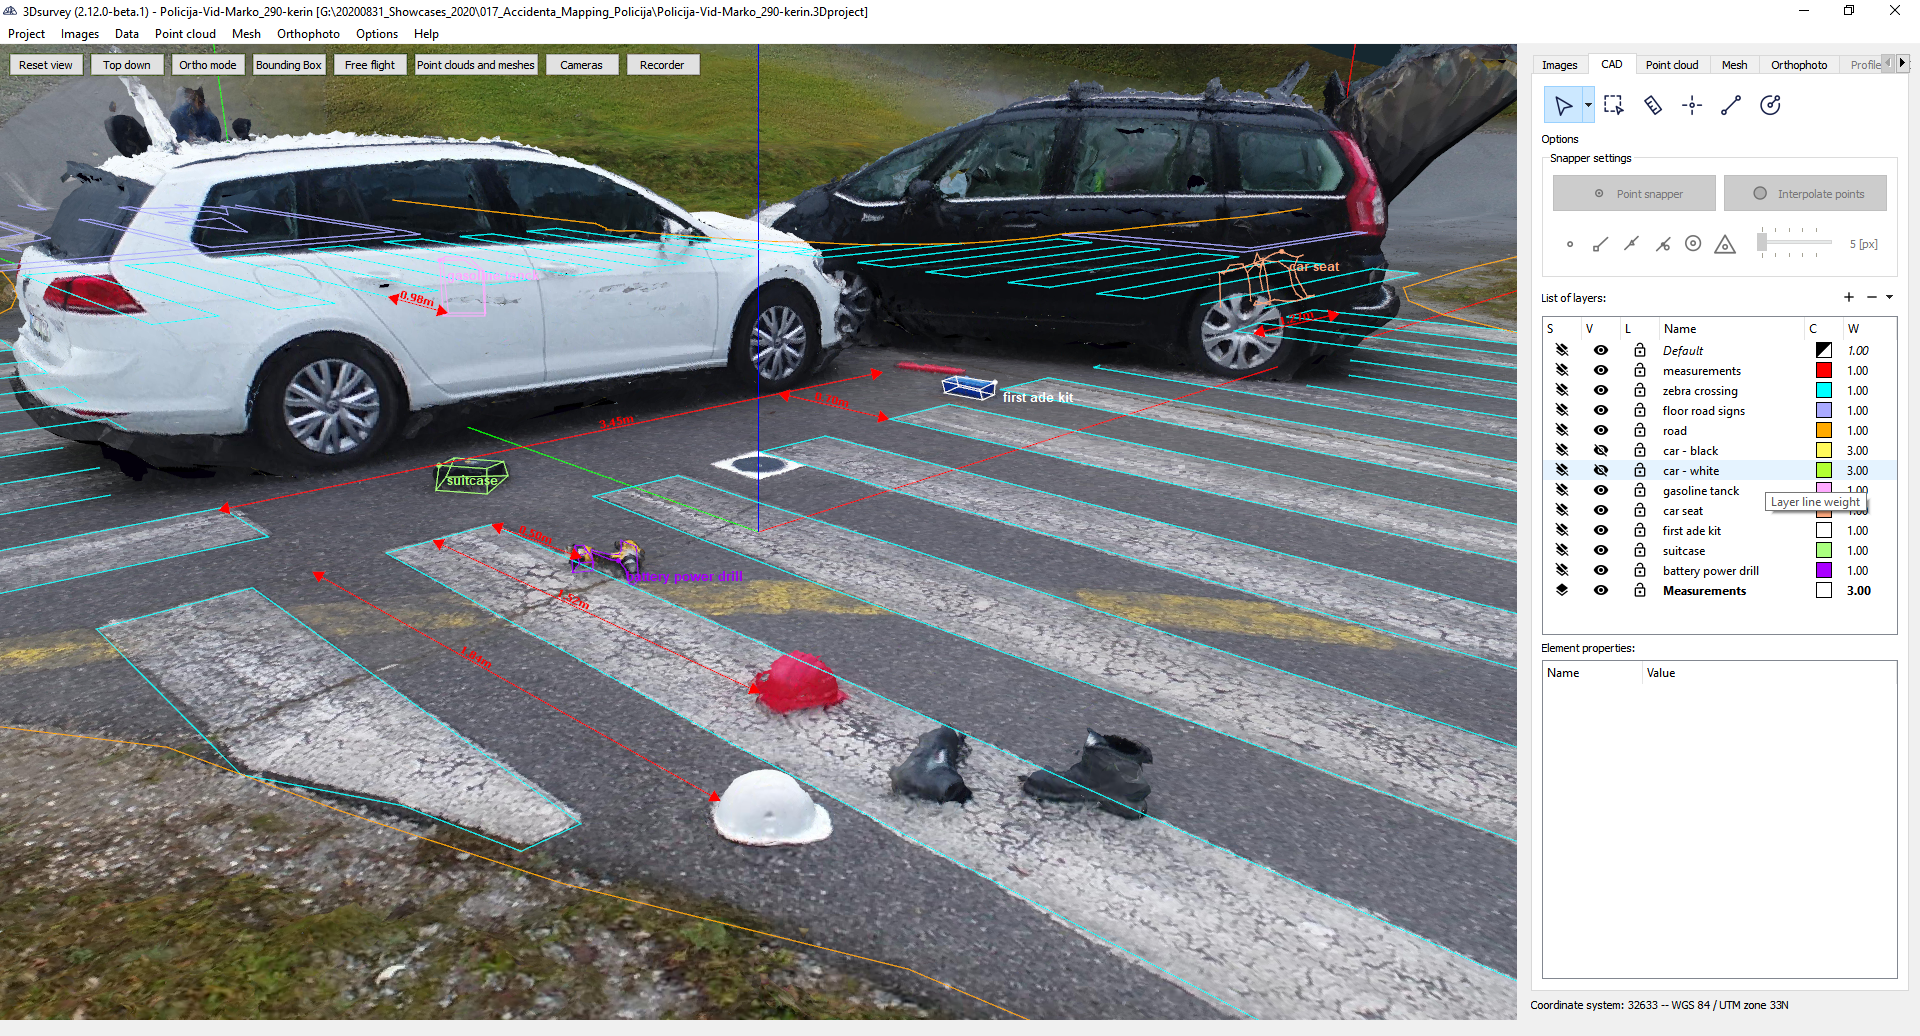
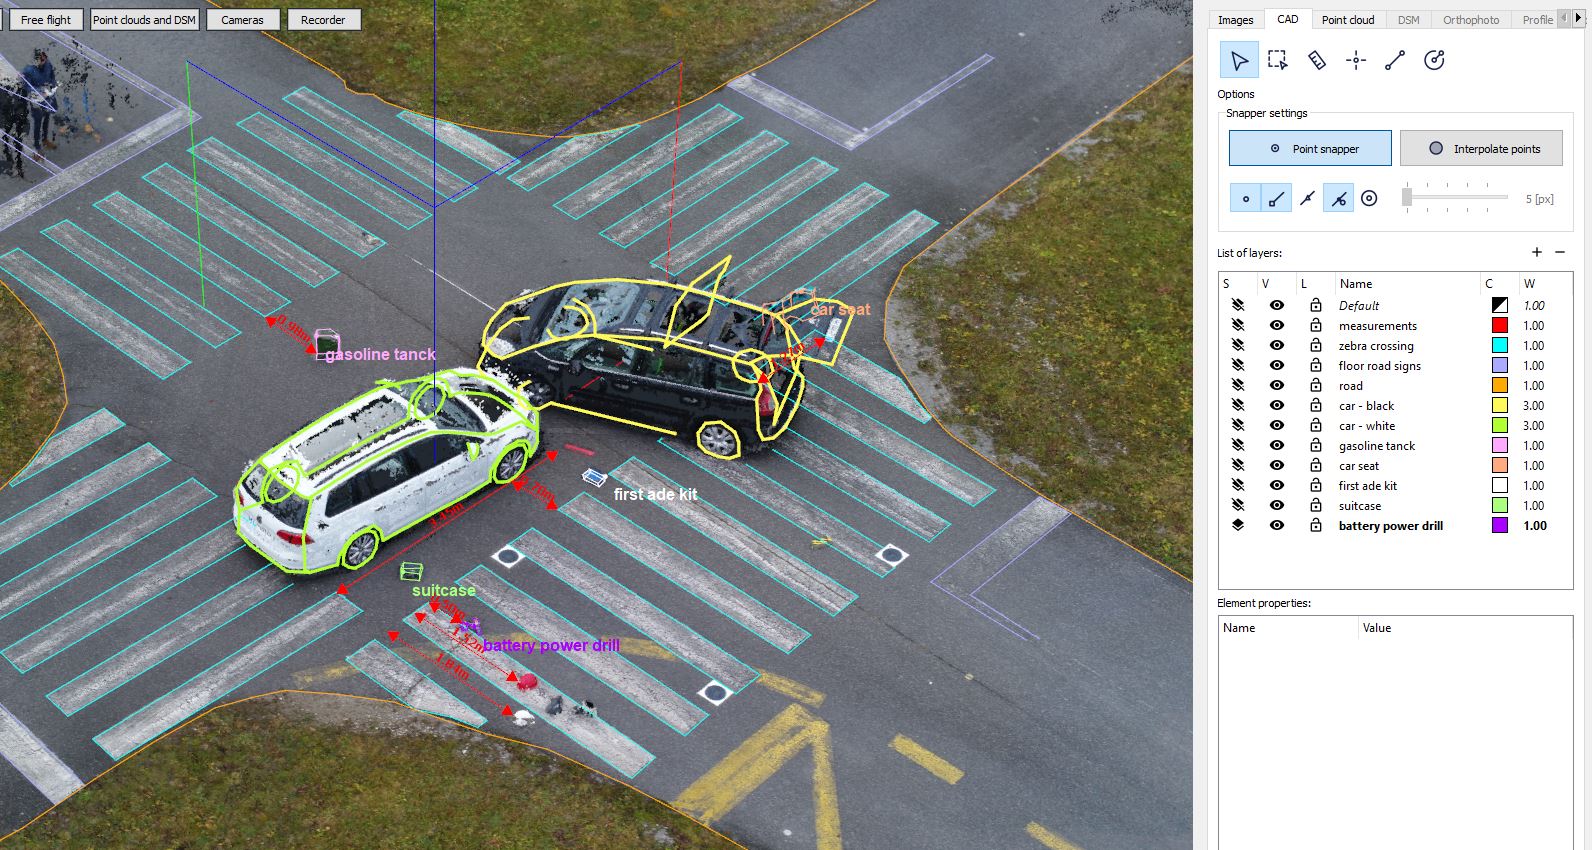
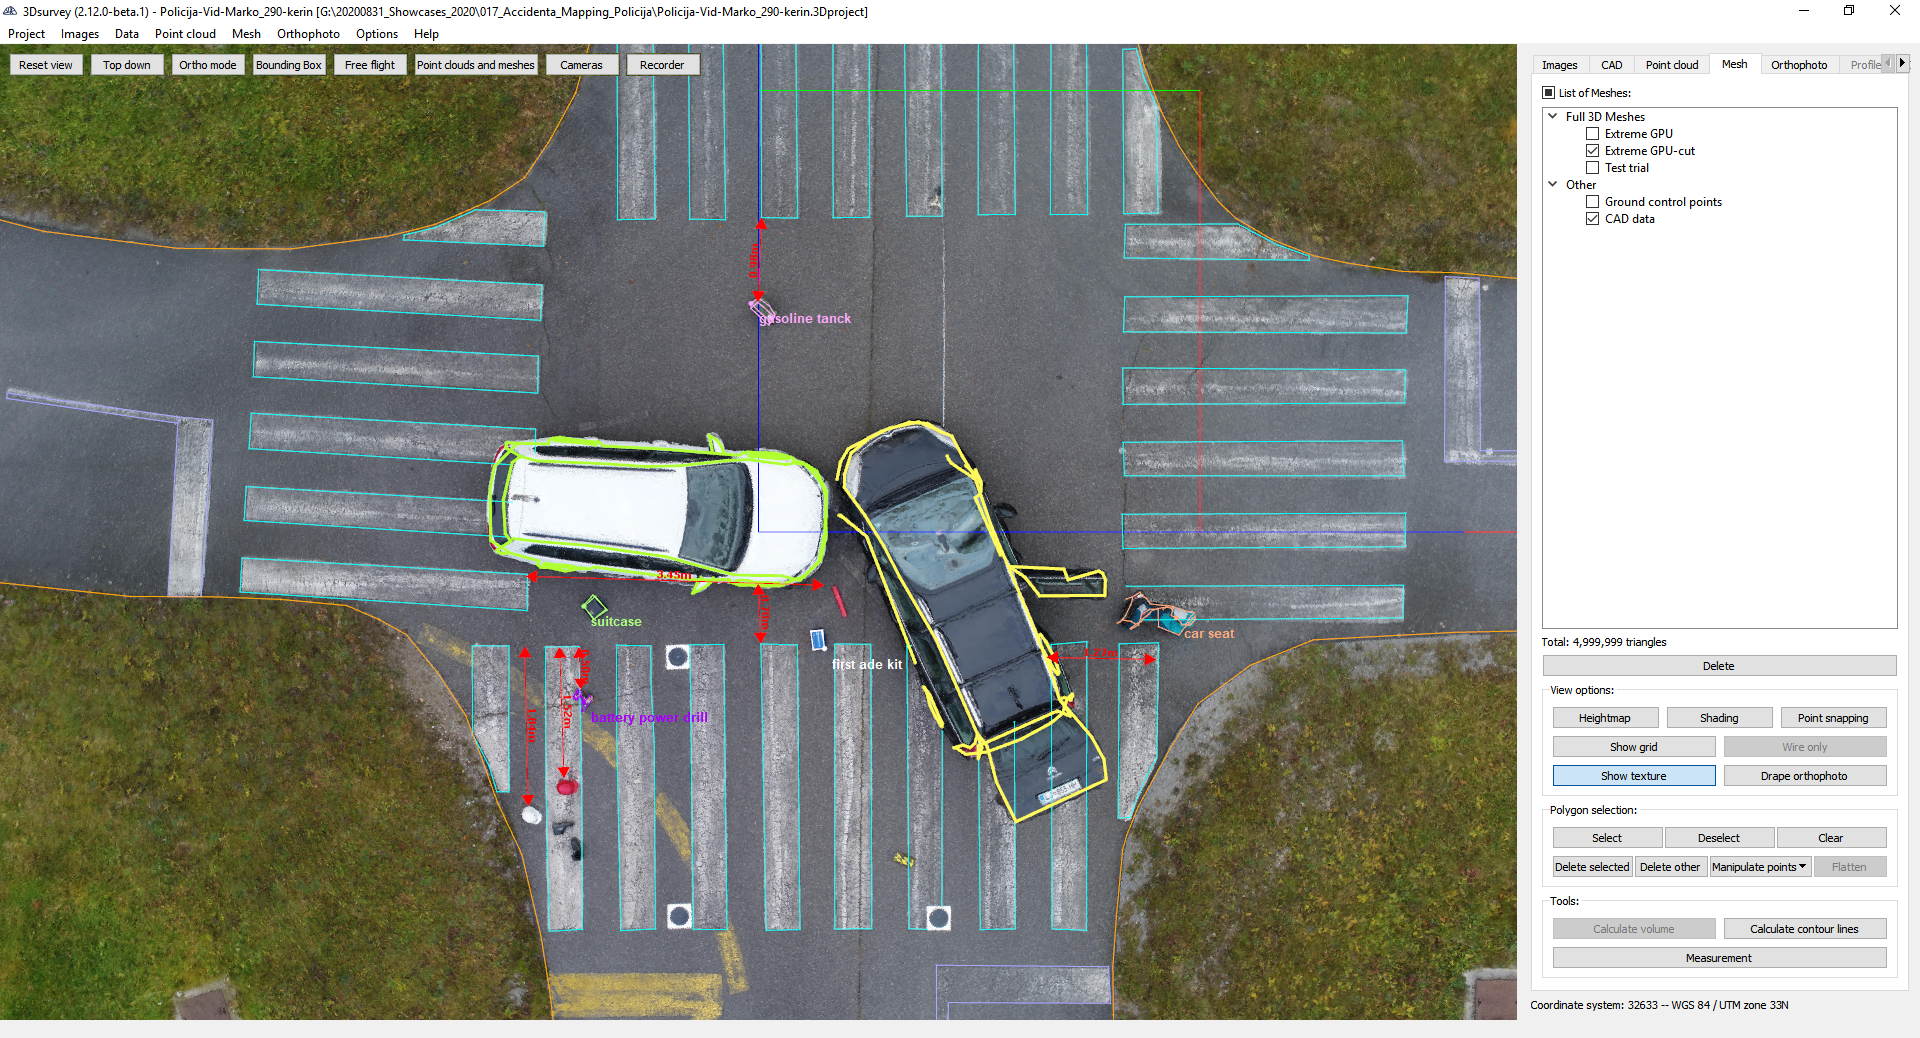
Next is the reconstruction that creates highly detailed 3D point cloud and generates a 3D model of the scene. This is a perfect data type input for Textured Full 3D model generation. For the measurements, integrated CAD functions were used. This gave the forensics exact details to reconstruct the accident (angles, distances, etc).
RESULTS
- Image acquisition: 15 minutes – on site.
- Complete data processing: 3 hours – off site, at the office.
Output:
- 3D model in OBJ format – standard 3D format
- 3D sketch with vector CAD lines (all details, distances, angles, measures, object relationship) export format DXF
- Orthophoto map in JPG and KMZ ready for Google Earth (possible accidents map creation, location defined…)


BENEFITS
- Forensic scene visualization / Immediate use of scene mapping for presentation in the court room
- Digitalised reality of the scene site
- Up to 7 x less time spent to gather and process data
- Best possible precision and accuracy in force calculations and distance measurements
- Up to 79% lower acquisition cost compared to other modern solutions
- Possible reuse of outputs for maps, other stakeholders
- Photogrammetry software compatible with multiple data inputs and drones
Want to know more about this topic? Check out our on-demand webinar.
If you have any questions, please email us at [email protected].