• Home
  • Software Updates
  • What’s new in 3Dsurvey 3.0

What’s new in 3Dsurvey 3.0

What's new in 3Dsurvey 3.0 banner
What’s new in 3Dsurvey 3.0

1. Coordinate system upgrade (PROJ)

We’re pleased about the recent improvements to our coordinate system functionalities in 3Dsurvey.

The foundation of every spatial project is georeferencing with the selection of a coordinate system – both horizontal and vertical. Choosing the correct coordinate system enables users to obtain accurate results at the correct coordinates. This solution offers users a faster path to precise georeferenced spatial data without unnecessary local transformations (which reduce accuracy) and without the need for 3rd party programs. All in one!

An upgraded coordinate system selection process with presets allows users to select the correct coordinate system much more easily – just type your country name and the right coordinate system will be preset for you!

With the right choice of coordinate system, we can fully leverage orientation using telemetry data and GCP points and use the full power of RTK technology.

For existing users who are satisfied with the current coordinate system support, we ensure a seamless transition to the upgraded system with all improvements.

For existing users who are not satisfied with the current solutions, we offer a final solution that will meet their needs for selecting the correct coordinate system and obtaining accurate results (a relief).

Benefits:

Screenshot of the Telemetry Importer window in 3Dsurvey
Select your country in the Coordinate system preset dropdown menu

Here’s a summary:

  1. Enhanced Coordinate System Support: We’ve upgraded our system to fully support transformations to coordinate systems that require special grid files. This ensures accurate conversion of GPS coordinates to local state coordinate systems for users in Austria, Belgium, Czechia, Hungary, Netherlands, Slovakia, and the UK.
  2. Simplified Geoid Model Integration: Geoid models can now be seamlessly integrated without manual downloads. If a geoid model is missing, 3Dsurvey will automatically fetch it, streamlining the workflow.
    a. PRJ File Support: We’ve added support for defining coordinate systems using PRJ files, offering greater compatibility with GIS standards.

Improved User Interface: The coordinate system setup interface has been revamped for a more intuitive experience. Additionally, coordinate system presets have been introduced for easy selection based on state or country names.

2. Automatic machine deactivation

We understand that users often need to deactivate their license to work from home or due to technical issues like a broken computer. Our new system addresses these needs efficiently.

For companies and schools/universities with multiple seats, managing licenses can be challenging, especially when users forget to log out. This often leads to licenses being unnecessarily occupied.

Our solution is instant deactivation: After you shut down your 3Dsurvey computer, the license is immediately freed up for use on another device. No more waiting or manual intervention required.

This option is available on demand – in case you are working offline on field you can disable this option before.

Benefits:

Screenshot showing the application settings window with the option to select automatic machine deactivation
Automatic machine deactivation button in Application Settings

3. Clip function

When mapping your area of interest and generating a 3D model or orthophoto, it’s common to capture more area than necessary. For instance, mapping a road or railway might quickly yield an orthophoto map with a width of 100 meters. However, you may only need to share a strip 10 meters to the left and right of the center line.

Our new Clip function empowers you to clip your results to the exact area you need. By using a CAD line (which you can import or create directly in 3Dsurvey CAD) you can precisely cut your data and share only the relevant portions with your customers.

Key Features:

  • Precision Cutting: Clip your data to the exact specifications needed.
  • CAD Integration: Import or create CAD lines in 3Dsurvey CAD to define your clipping area.
  • Versatile Application: Works on point clouds, mesh, and orthophotos.

Benefits:

Screenshot of point cloud before clipping in 3Dsurvey
Before clip
Screenshot of point cloud after clipping in 3Dsurvey
After clip

4. Balloon fix

In the past, generating a full 3D mesh could result in a large dome covering your entire 3D model. This meant extra work selecting the unwanted “dome” parts and deleting the mesh triangles to isolate the area of interest.

With our enhanced mesh algorithm we’ve prevented this dome effect from happening so you don’t need to spend additional time cleaning your 3D model and can focus on real work.

Screenshot of a dome-like mesh in 3Dsurvey
Sometimes you may have gotten this sort of dome effect. It’s interesting, but not accurate.

5. Additional colormaps

New, discrete color ramps are available. These colormaps give your point clouds clearer distinction between various values, be it on heightmap, intensity, or scanning time.

Additional colormaps and explanation in a textbox
New discrete color maps

6. Script engine update

This update gives you an option to pre-write your (JavaScript) script to process your data without the user interface. Have the benefit of automating certain tasks and processing your data without even opening the app. 

You have the added benefit of being able to process multiple datasets one after another, and/or processing one dataset multiple times on different settings. There is a list of supported commands, and not all of them are included.

  • Documentation
  • Support for Perpetual license type

7. Optional add-on module system

7.1. Scan

Turn 3D point clouds into “CAD friendly drawing planes”. It’s like X-ray orthophoto, but in any direction and all at the same time on one screen.

  • Create sections
  • Define the planes and axis that you want visualized
  • Rotate your model
  • Use basic CAD tools to place points and draw lines.
  • CAD can be edited and adjusted on dense point cloud
  • Perfect tool for creating floor plans
X-ray views environment
When you need to align two 3D models that share at least some features, manual registration is the most straightforward solution. The all-new manual registration wizard is a powerful tool that simplifies this task to child’s play.  Pick distinctive points in the left window, find them in  the right window where they will get projected. The points can also be imported from file or CAD layer. This works on the data of various sources, formats, scales and orientations. You can also fit a point cloud to a mesh or vice-versa. When you are sure the size needs no corrections check the “Fix scale” box, If you are limited to a single floor scan, use the “Fix Z axis” option. You can also make it generate a report for you.

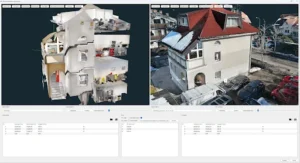
Fit the 3D mesh of an interior scan with the photogrammetry point cloud outside.

We also added some neat visualization tools to aid you with precise point placing. The error window in the middle will notify you when your transformation will produce inaccurate results.  It also takes in full 3D meshes. 

Automatic aligning or registering different datasets. This is a method that helps you fit together two or more point clouds so they form a coherent image of the physical world. 

The algorithm works on a principle of minimizing the distance between corresponding points of two point clouds (photogrammetry or LiDAR scan) that represent the same area or object from different viewpoints. It's like trying to align two slightly mismatched photos of the same scene so that they line up perfectly.

How does it work?

In order to get the algorithm started, we need to give it a first directional alignment. This is done in the manual matching wizard (selecting at least 3 common points in two point clouds). Then, for each point in one cloud, the algorithm finds the closest point in the other cloud. Then it minimizes the distance between these matched points through optimal rotation and translation after that the process repeats until the two point clouds fit perfectly. 

Benefits: 

Accuracy: ICP can achieve very accurate alignments, essential for creating precise 3D models and maps.

Automation: While the initial guess is manual, the iterative process is automated, saving time and effort.

Visualizing additional attributes that come from your 3D scanner is the wow!

Intensity

Intensity data, alongside the usual 3D point information, is an extra layer of information captured by laser scanners. Intensity refers to the measurement of the strength or magnitude of the reflected laser signal received by the scanner from a surface point.

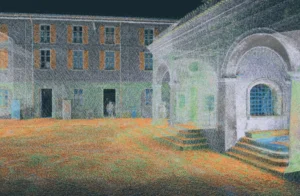
Intensity visualization

Scanning time

To include the temporal component of your 3D scan, turn on the “Scanning time” visualization mode. Available in all of the expanded colormaps, it gives you the idea of how the point cloud was gathered, where the scanning started and where it ended.

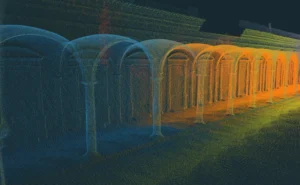
Scanning time visualization

Return data

When a single laser pulse encounters multiple reflective surfaces, it generates multiple returns. This value specifies which reflection this data point corresponds to (e.g., first return, second return). The first return from a laser pulse typically corresponds to the highest reflecting object in the path (e.g., treetop, building roof, open ground). 

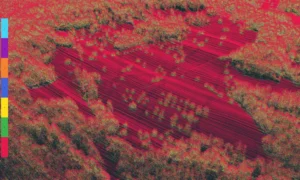
Return data visualization

Unlock the power of your point cloud data with our new feature that allows you to create orthophotos directly from a point cloud. This is especially useful for RGB scan data, making it easier than ever to extract valuable information for your project.

2D orthophotos are often the simplest way to derive essential data. Now, even if you only have LIDAR scans with color information and no photogrammetry data, you can generate detailed orthophotos effortlessly.

7.2 RTK Videogrammetry

As a natural progression, photogrammetry has paved the way for videogrammetry as an additional method to improve and enhance data collection for surveying professionals. One of the most significant advantages of videogrammetry in surveying is its ability to acquire data swiftly and efficiently. Videogrammetry facilitated by smartphones offers a quick and easy approach to documenting hard to reach areas or places where drone flight is restricted. 

Videogrammetry’s standout feature is the elimination of overlap concerns, since the video is continuously shot with 30 fps or more. Integrating videogrammetry into your data collection toolkit promises to accelerate project timelines, streamline workflows and above all make you more responsive, since a smart phone is always on site. This makes videogrammetry a cost-effective solution for surveying tasks. 

Using external RTK antenna 

The main advantage of this module is unparalleled videogrammetry accuracy. This is achieved by attaching an external RTK antenna to your phone. Setting it up is similar to setting up an RTK drone. Read the instructions for all the information.

Download PDF Instructions:

Land surveyor onsite holding a smartphone with attached RTK GNSS device
REDCatch RTK GNSS for your smartphone

3Dsurvey SiteScan app

This module brings you a new Android smartphone app. It’s simple and clean, displaying you just the information you need on site. It is also very easy to use and comes free with this module.

Screenshot of 3Dsurvey SiteScan app recording interface
Capturing geotagged video footage with 3Dsurvey SiteScan app

Read location metadata from video file

When you are done on the field, similar to a classic drone / photogrammetry job, just upload the video to your computer and feed it into 3Dsurvey to extract the best frames from it.

Enjoy the full functionality of 3Dsurvey with additional modules!

Video to image converter window
Importing a video into 3Dsurvey to convert it into image frames

8. Minor improvements

Ready to go?

Version 3.0 is available to all existing users with an active 3Dsurvey Yearly Support & Upgrades extension, or active Subscription license.

Version 3.0 is also available for trial for all previous trial users and existing customers with inactive Support & Upgrades.

Facebook
Twitter
LinkedIn

Subscribe to our newsletter

What’s new in the field? Stay up to date with our newsletter!

NEW WEBINAR

What’s new in 3Dsurvey 3.1

17 April 2025
2pm – 3:30pm CEST

Days
Hours
Minutes
Seconds

You will be redirected to GoToWebinar to register.

Back On Track

50% on updates

Offer valid until 24th March.